Browse the article
- What delimitation changes
- Why seat allocation was frozen
- Assam and the gerrymandering allegations
- What the April 2026 package proposed
- How the seats are divided
- Case 1 with 35 seats for Union Territories
- Case 2 using one population pool
- Case 3 with a proportional increase
- The regional distribution
- Seats and decisions at the Centre
- Powers held by the Centre
- Changes to law making powers
- How service tax developed
- What GST changed
- Revenue and investigations
- Punjab in the Lok Sabha
- Punjab’s Assembly is a separate calculation
- Punjab district Assembly seat illustrations
- Where the Census and electoral rolls fit
- What still has to be decided
- State and Union Territory allocation appendix
Punjab has 13 MPs in today’s 543-seat Lok Sabha. In one population-based calculation for a House of 850, it would have 19 MPs. Its number of MPs would rise, but Punjab would account for a smaller part of the larger House: 2.24%, compared with 2.39% today.
That difference runs through the delimitation debate. A state may gain members while other states gain faster. The number of MPs and their share of the whole House tell different parts of the story.
The question also has a history. The allocation among states has remained tied to the 1971 population basis through a constitutional freeze. Later boundary changes took place without a general redistribution of state seat totals. The April 2026 proposals sought a different framework, but the Constitution amendment did not secure the required majority.[5][11]
Panj Teer Research compares three approaches, with two versions of the proportional-increase approach. They produce Houses of 827, 850, 824 and 850 members. Punjab receives 20, 19, 20 and 20 seats respectively. These are calculations under clearly stated assumptions, using 2011 population or existing seat allocations. They are not announced future constituencies.
These seat changes matter because the Union already exercises substantial powers affecting the states. Changing representation at the Centre can change which regions have a greater presence where those powers are exercised. Punjab’s Assembly presents a further, separate question about representation within the state.
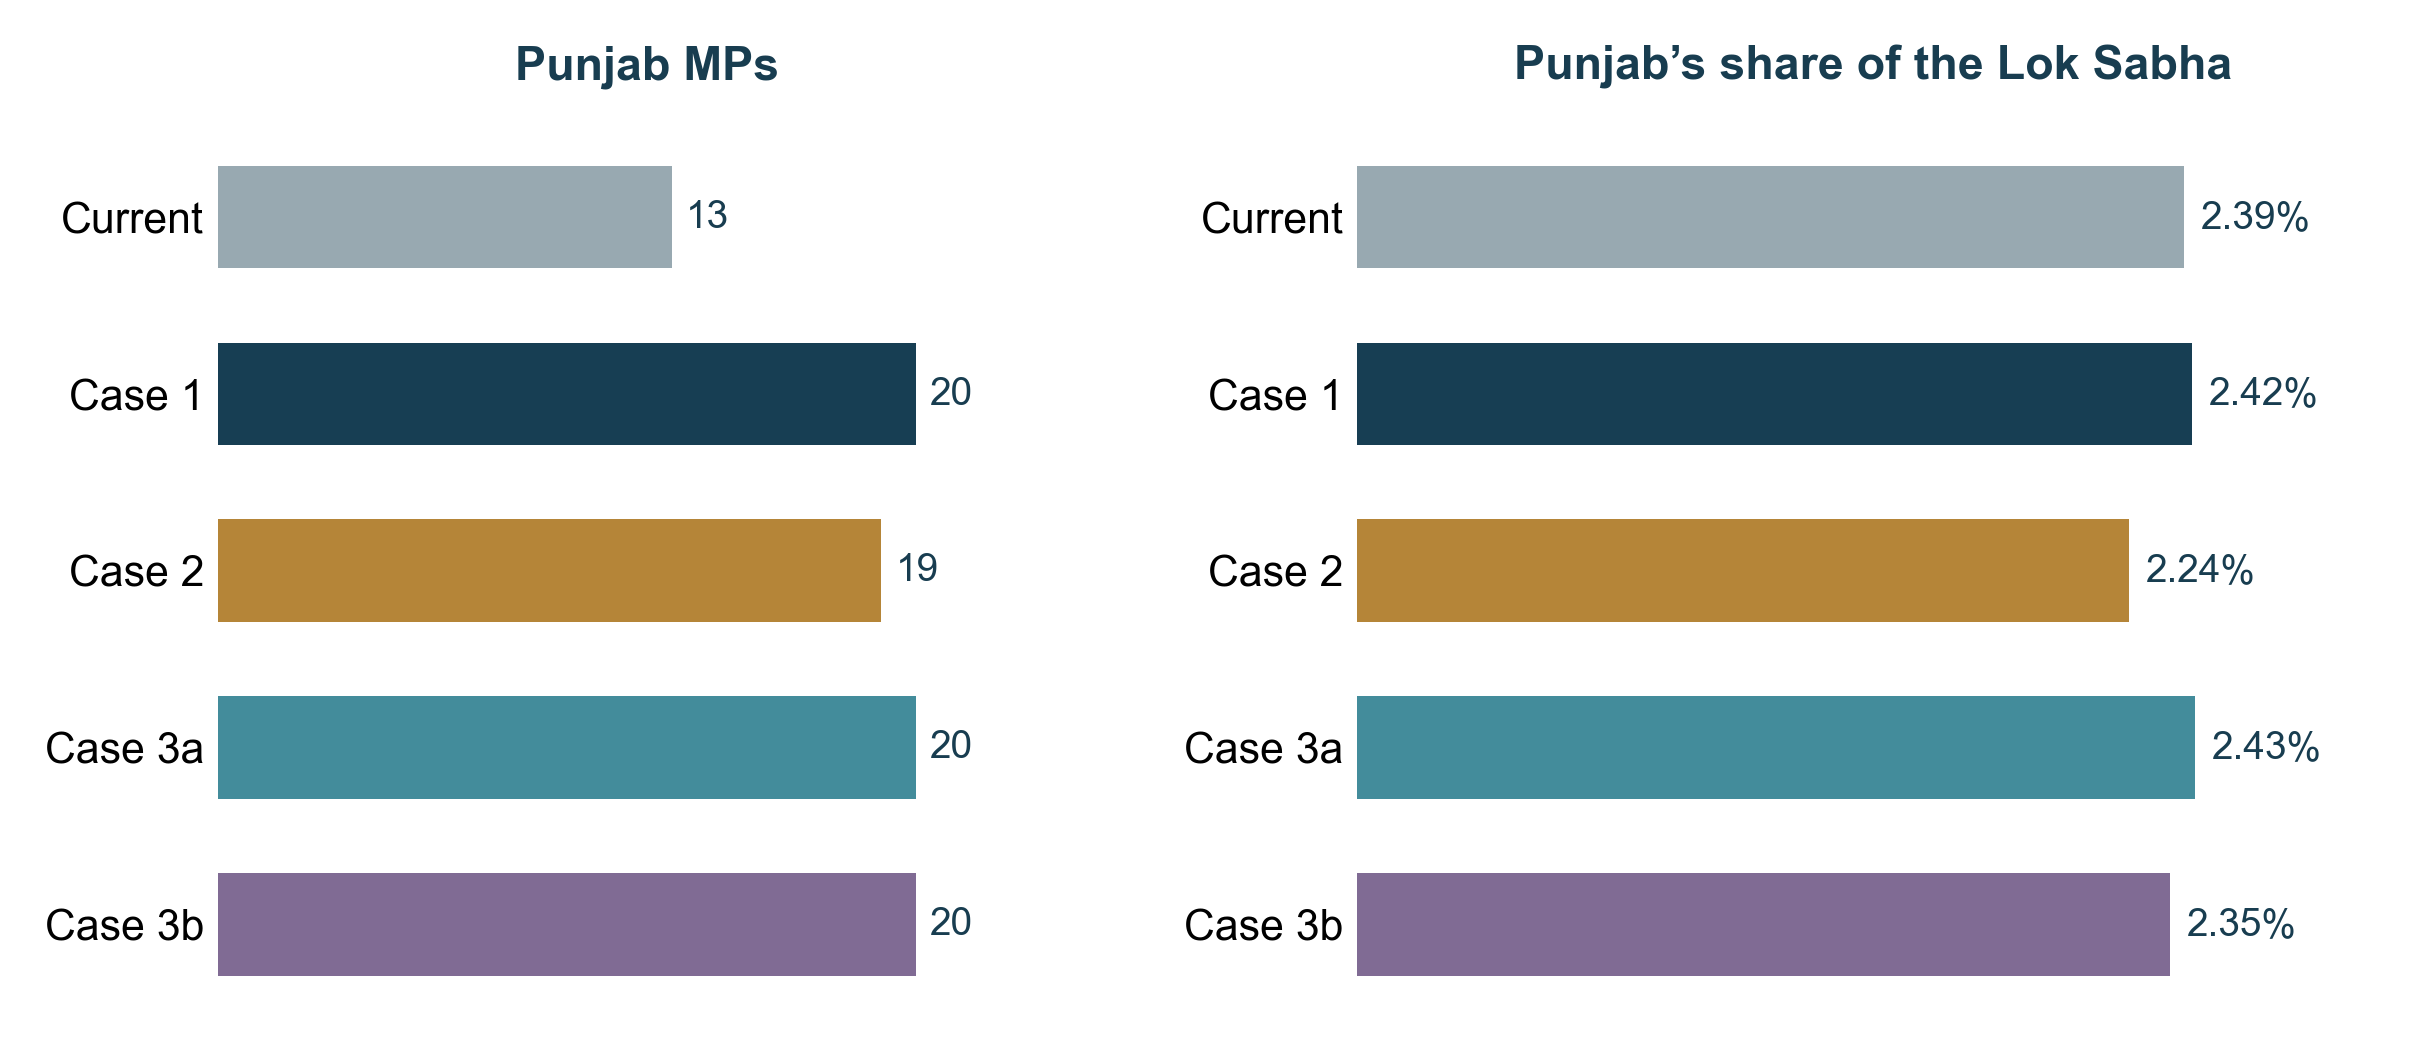
Current allocation compared with Panj Teer’s four calculations. Future seat numbers and shares depend on the rules described below.
What delimitation changes
Delimitation fixes the territory from which a representative is elected. It can involve drawing new constituency boundaries. Where the governing law allows it, it also includes working out how many seats a state receives. Those are connected tasks, but they are different decisions.[2][3]
Suppose a state keeps the same number of MPs while people move between its towns and villages. Boundaries can be redrawn within the state to take account of the population distribution, with the state total held fixed. A different exercise could first change the state’s total and then draw the constituencies needed for that new number. The legal instructions decide which exercise is being undertaken.
The Census provides population figures. The allocation rule turns those figures, or another stated basis, into a number of seats. Boundary work then identifies the villages, wards and other areas inside each constituency. A coloured state map can show an allocation; it cannot, on its own, tell a reader where a new constituency will begin or end.
Commissions were appointed in 1952, 1963 and 1973 under successive delimitation laws. The 2002 Commission worked under a later law and the constitutional freeze. The government’s 2025 account also lists the Commission constituted in 2020 for the later Jammu and Kashmir exercise. Their instructions differed, as the table shows.[2][23]
| Year |
Governing law |
Population basis |
Main distinction |
| 1952 |
Delimitation Commission Act 1952 |
1951 Census |
Earlier population-based readjustment |
| 1963 |
Delimitation Commission Act 1962 |
1961 Census |
Readjustment after the next Census |
| 1973 |
Delimitation Act 1972 |
1971 Census |
Basis retained for the later freeze |
| 2002 |
Delimitation Act 2002 |
2001 Census after the 2003 amendment |
Boundaries revised with state totals held fixed |
| 2020 |
Delimitation Act 2002 and J&K Reorganisation Act |
2011 Census for J&K |
A separate J&K exercise |
| 2023 |
Representation of the People Act 1950 section 8A |
2001 Census for Assam |
ECI redrew Assam’s boundaries; state totals stayed fixed |
Years for the commissions are appointment years; 2023 refers to Assam’s final order. Sources 2, 3, 6, 23 and 27.
Boundary work also involved draft proposals and public objections. The 2002 law provided for associate members from the elected institutions, publication of proposals and public sittings. Its geographic considerations included compact areas, administrative boundaries, communication and public convenience. A population calculation therefore did not complete the task of drawing a usable constituency.[3]
There have also been later exercises under specific arrangements. Jammu and Kashmir’s final delimitation order was published in May 2022. Assam’s 2023 orders were brought into effect on 16 August 2023. These need to be distinguished from a nationwide change in the number of MPs allocated among all states.[21][22]
Why seat allocation was frozen
The freeze began through the 42nd Amendment in 1976. It retained the 1971 population basis until the relevant figures of the first Census taken after 2000 were published. The 84th Amendment later extended the Census-linked limit to the first Census after 2026.[4][5]
The official explanation for the extension connects the earlier freeze with family-planning norms. It says the extension was intended to allow state governments to continue working towards population stabilisation. This is the stated reason in the legislative record. It helps explain why the choice of population year became a question between states.[5]
The extension did not leave every boundary untouched. The 84th Amendment allowed readjustment within states while keeping their total Lok Sabha and Assembly seats fixed. The 87th Amendment in 2003 changed the boundary population base from 1991 to 2001. The Commission’s work therefore used newer population figures for boundaries without a general reallocation of state totals.[5][6]
This distinction matters when looking at the map used in elections. A constituency may have a relatively recent boundary while its state’s total seats still rest on the older allocation basis. The 2002–08 exercise can be understood in those terms. Changes in the location of reserved constituencies were another part of the exercise; reservation and the total number of a state’s seats should not be treated as one figure.[3][6]
The 84th Amendment received assent on 21 February 2002. Its commonly cited title is the Constitution Eighty-fourth Amendment Act, 2001. The appointment of the later Commission, publication of Census figures and commencement of its orders were further stages. Keeping those dates separate avoids treating a law’s title year as the date on which every boundary changed.[5]
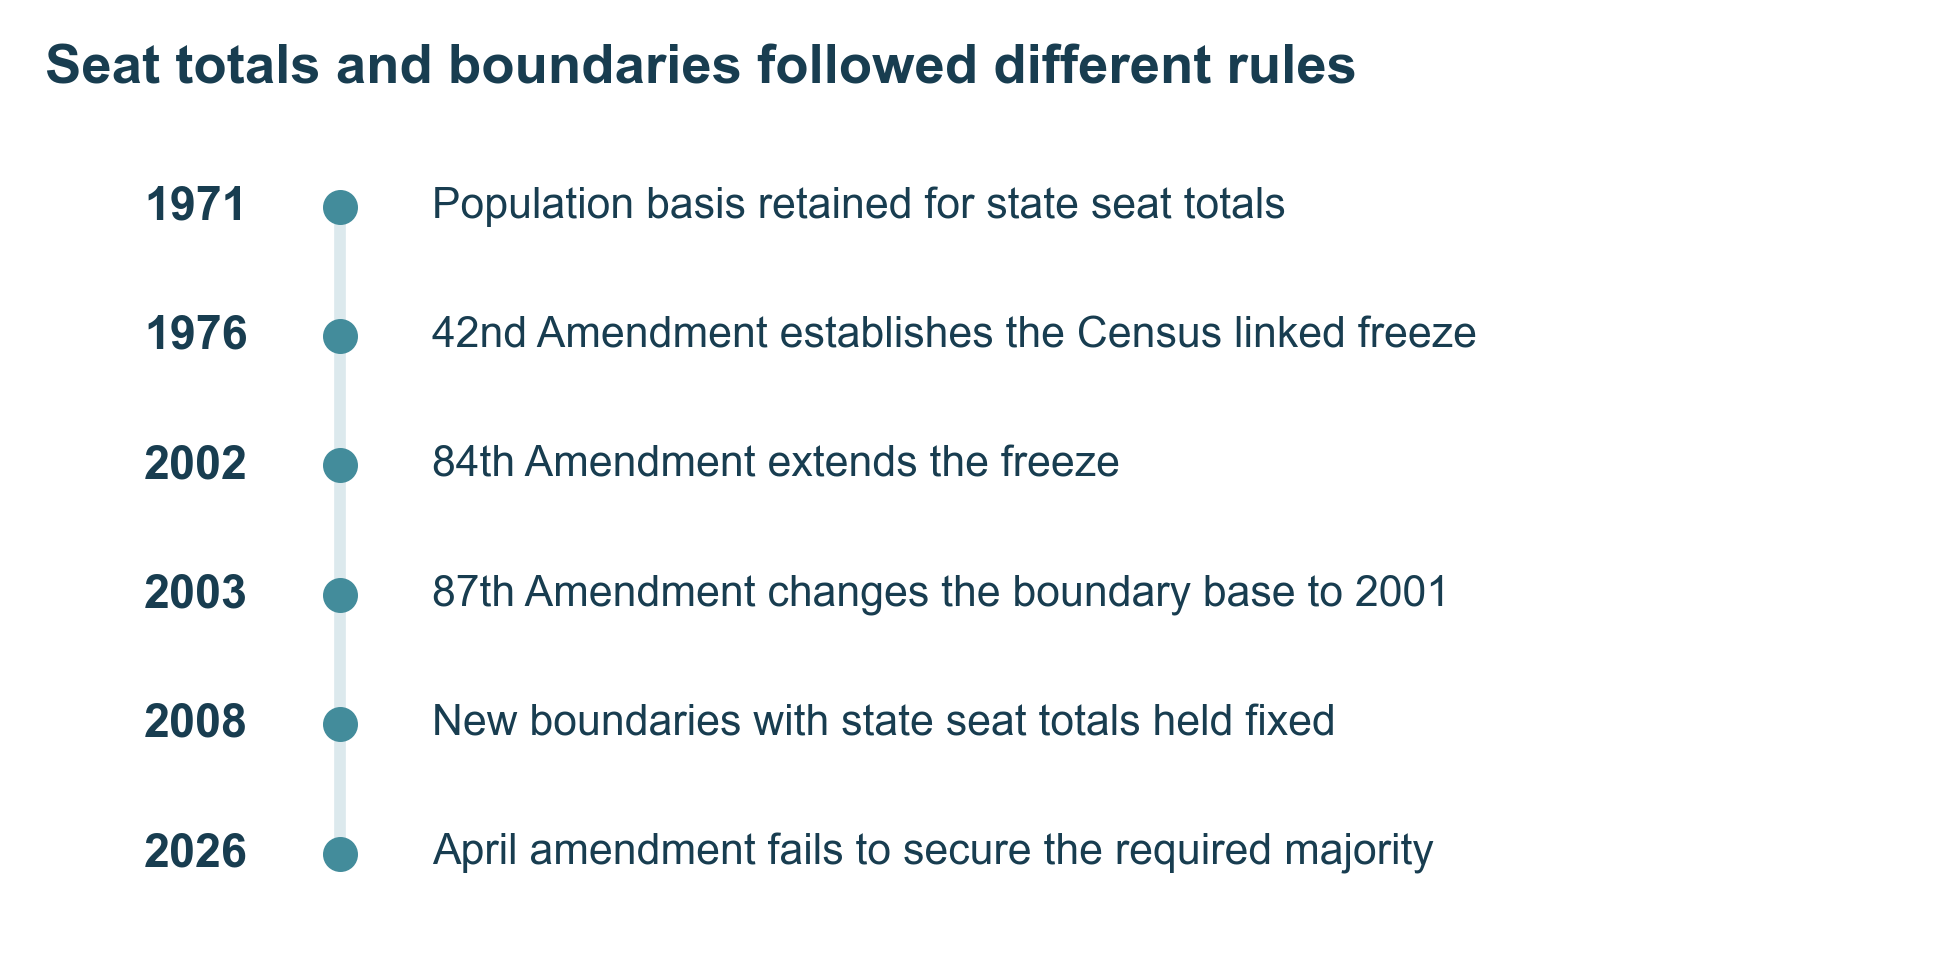
The freeze preserved the population basis for state totals. Later amendments permitted boundary readjustment using newer Census figures. The dates refer to the events stated, rather than a single continuous boundary exercise.
The current constitutional wording turns on publication of the relevant figures of the first Census taken after 2026. The end of the calendar year alone does not produce a new allocation. A governing legal framework, published population figures, the allocation and boundary work, and the dates on which the resulting arrangements take effect remain distinct matters.[12]
Assam and the gerrymandering allegations
Assam went through a separate delimitation exercise in 2023. The Election Commission carried it out under Section 8A of the Representation of the People Act, 1950, rather than through a newly appointed Delimitation Commission. A 2008 deferment had been lifted in February 2020. The draft came on 20 June 2023, the final order on 11 August, and the new arrangements took effect on 16 August.[22][27][28]
The exercise used the 2001 Census. Assam kept 14 Lok Sabha and 126 Assembly seats, but their boundaries and some reservation arrangements changed. It was the state’s first such boundary exercise since 1976.[27][29]
| Assam measure |
Before the exercise |
After the 2023 order |
| Lok Sabha seats |
14 |
14 |
| Assembly seats |
126 |
126 |
| Assembly seats reserved for SCs |
8 |
9 |
| Assembly seats reserved for STs |
16 |
19 |
| Assembly seats in the Bodoland districts |
11 |
15 |
| Assembly seats in Barak Valley |
15 |
13 |
SC and ST mean Scheduled Castes and Scheduled Tribes. Reservation is included within the total seats. Sources 27, 29 and 30.
One disputed part was the use of population density when dividing Assembly seats among districts. The ECI put districts in three groups and used different average populations per seat. Its published method is shown below.[27]
| District population density |
Average population used per Assembly seat |
| Below 304 people per sq. km |
1,90,397 |
| 304 to 372 people per sq. km |
2,11,552 |
| Above 372 people per sq. km |
2,32,707 |
The ECI said geography, administrative units, communication and public convenience justified departures from a single average. Source 27.
Gerrymandering means drawing constituency boundaries to give a party or group an electoral advantage. In Assam, critics alleged that minority voters were being concentrated in fewer seats, while other areas were regrouped to help the BJP and its allies. These were allegations about the design and purpose of the boundaries.[30][32]
In August 2023, AIUDF leader Badruddin Ajmal alleged that the number of seats in which Muslim voters had influence had fallen by about 10 or 11. Congress leader Debabrata Saikia objected to population disparities and the grouping of distant areas in Dhubri. Ajmal’s figure was a political claim about voter influence, not an official category of seats reserved by religion.[30]
The allegations returned to the national debate in April 2026. Rahul Gandhi and Gaurav Gogoi cited Assam while accusing the BJP of gerrymandering. The reported examples included the redrawing of Kaliabor into Kaziranga and changes around Nagaon, Barpeta and Dhubri. Chenga, Mandia and Srijangram were among the Assembly segments included in the redrawn Dhubri parliamentary seat.[32]
BJP representatives rejected the charge. In June 2023, its MP Pabitra Margherita described the exercise as neutral and said that sitting members of the ruling party had also lost their old seats. The party defended the proposals as protecting indigenous communities. Assam Chief Minister Himanta Biswa Sarma also publicly supported the draft on those grounds.[31]
The ECI said it considered 1,222 representations and addressed about 45% of the suggestions and objections in the final proposal. It cited constitutional and statutory rules as the basis of its decisions.[27]
There was also a court challenge. On 24 July 2023, the Supreme Court issued notice on challenges to Section 8A, the procedure and the use of population density. It declined to stop the process at that stage, leaving the constitutional challenge for later consideration. That was the scope of the July order; it was not a final decision on the allegations of partisan boundary drawing.[28]
What the April 2026 package proposed
The Constitution amendment introduced in April proposed ceilings of 815 members elected from states and 35 representing Union Territories. Together they allowed a maximum of 850. A ceiling is an upper limit. The words did not themselves require that all 850 places be filled.[7]
The accompanying Delimitation Bill used the latest Census figures published when the Commission was constituted. The package sought changes to the constitutional Census provisions. It also dealt with women’s reservation and proposed that a state’s Assembly total be a whole-number multiple of its Lok Sabha allocation. It did not prescribe a multiplier of nine for Punjab.[7][8]
The Home Minister’s statements supplied a further element. The official releases described a 50% increase for states and illustrated a national House of 816. Five southern-state examples were provided: Karnataka 42, Andhra Pradesh 38, Telangana 26, Tamil Nadu 59 and Kerala 30. Those figures total 195.[9][10]
The introduced bill text did not contain a per-state 50% guarantee or a complete allocation schedule. The published ministerial illustration did not divide 35 seats among all eight UTs or give a Punjab figure. A research calculation combining an exact UT pool with a minimum increase for states must therefore identify those added assumptions.[7][9]
| Item |
What the source provides |
Treatment in this article |
| Constitution amendment |
Up to 815 state seats and up to 35 UT seats |
Proposed ceilings, not a completed allocation |
| Ministerial illustration |
50% increase and a national total of 816 |
Reported separately with attribution |
| Panj Teer Case 1 |
Exactly 35 UT seats and minimum whole seats giving states at least 50% more |
A reconstruction under stated assumptions |
The bill’s ceilings, the minister’s 816-seat illustration and Panj Teer’s 827-seat calculation are separate figures.
On 18 April, the Ministry of Parliamentary Affairs recorded that the Constitution amendment had not obtained the majority required under Article 368 on its consideration motion. The dependent Delimitation Bill and Union Territories Laws amendment were not proceeded with. The figures discussed in that package remained proposals.[11]
This article retains 2011 as the population year for its population calculations. It also uses the present 36-unit geography in the calculation file, with populations reconciled to the final 2011 national total. Nothing in the calculation estimates how many residents a state will have when a future exercise is conducted.[24][25][26]
How the seats are divided
Before comparing results, several choices need to be visible. First comes the population year. Using a different Census changes the population shares being compared. Second comes the size of the House. A state’s share is its seats divided by that national total. Third comes the rule for the state and UT pools.
| Research calculation |
Main rule |
Total seats |
| Case 1 |
At least 50% more for each state; exactly 35 for UTs |
827 |
| Case 2 |
One pool based on 2011 population; current seats protected |
850 |
| Case 3a |
50% increase for every state and UT, rounded separately |
824 |
| Case 3b |
Existing seat proportions expanded to a fixed total |
850 |
These are Panj Teer calculations. They are distinct from the government’s published 816-seat illustration.
Protection of current seats is another decision. In the population case here, no state or UT can receive fewer seats than it has now. Where that minimum is above a population quota, the minimum still has to be honoured within the fixed national total. The adjustment is part of the allocation, rather than a note added after the calculation.
Small-state provisions also need attention. Article 81 contains an exception to the usual interstate population-to-seat rule for states below the specified population threshold. Its applicable Census basis is part of the constitutional provision. A single heading such as Northeast cannot substitute for checking the circumstances of each state.[12]
The Census population used for seat allocation is different from the electoral roll. Residents include people below voting age. A voter-roll total, turnout figure or list of entries under scrutiny is a different measure. In these calculations, Case 2 uses Census population; Cases 3a and 3b use existing seats. The inputs are identified so readers can reproduce the comparison.
| Factor |
What readers need to know |
How it is treated here |
| Population year |
Which population is being compared |
2011 in population calculations |
| Current seats |
Whether absolute seats can fall |
Each current allocation is protected |
| State and UT pools |
Whether UT seats are fixed separately |
35 in Case 1; no separate pool in Cases 2 or 3 |
| Whole seats |
How fractions become seats |
Upward rounding or a fixed-total adjustment, stated for each case |
| Assembly size |
Which multiplier is assumed |
Nine for the Punjab illustrations |
| Boundaries and reservation |
Which geography and rules apply |
Separate decisions, not drawn by the seat calculations |
Language, regional identity, community representation and the history of population stabilisation are relevant subjects in the debate. They are not entered here as extra numerical weights in the formula. GDP and tax receipts are also not substituted for population. Any proposal to give those measures a particular weight would be an additional policy choice.
Reserved seats require a separate calculation under the applicable constitutional provisions, including the SC and ST population basis. Women’s reservation was set out by the 106th Amendment in 2023, with conditions for bringing it into operation. The April 2026 package sought changes connected with its implementation. The failure of that later package should be distinguished from the existence of the 2023 amendment.[7][8][12]
Births, deaths and migration need their own measures when explaining population change. A recent fertility rate does not describe all change since 1971, and a language share is not a count of migrants. The current comparisons use the stated Census population as a whole. They do not assign a separate seat entitlement to a language or migrant group.
Case 1 with 35 seats for Union Territories
The first calculation combines an exact pool of 35 for UTs with at least 50% more seats for every state. Each state receives the smallest whole number that meets the increase. Punjab’s 13 multiplied by one and a half is 19.5, so the result is 20. A state with two seats receives three, while a state with one receives two.
Across the 28 states, this rule gives 792 seats. Adding the fixed UT pool gives a national total of 827. The calculation stops there. It does not distribute extra state seats merely to reach 850. The 827 total is the outcome of these assumptions, not a number attributed to the minister’s published illustration.
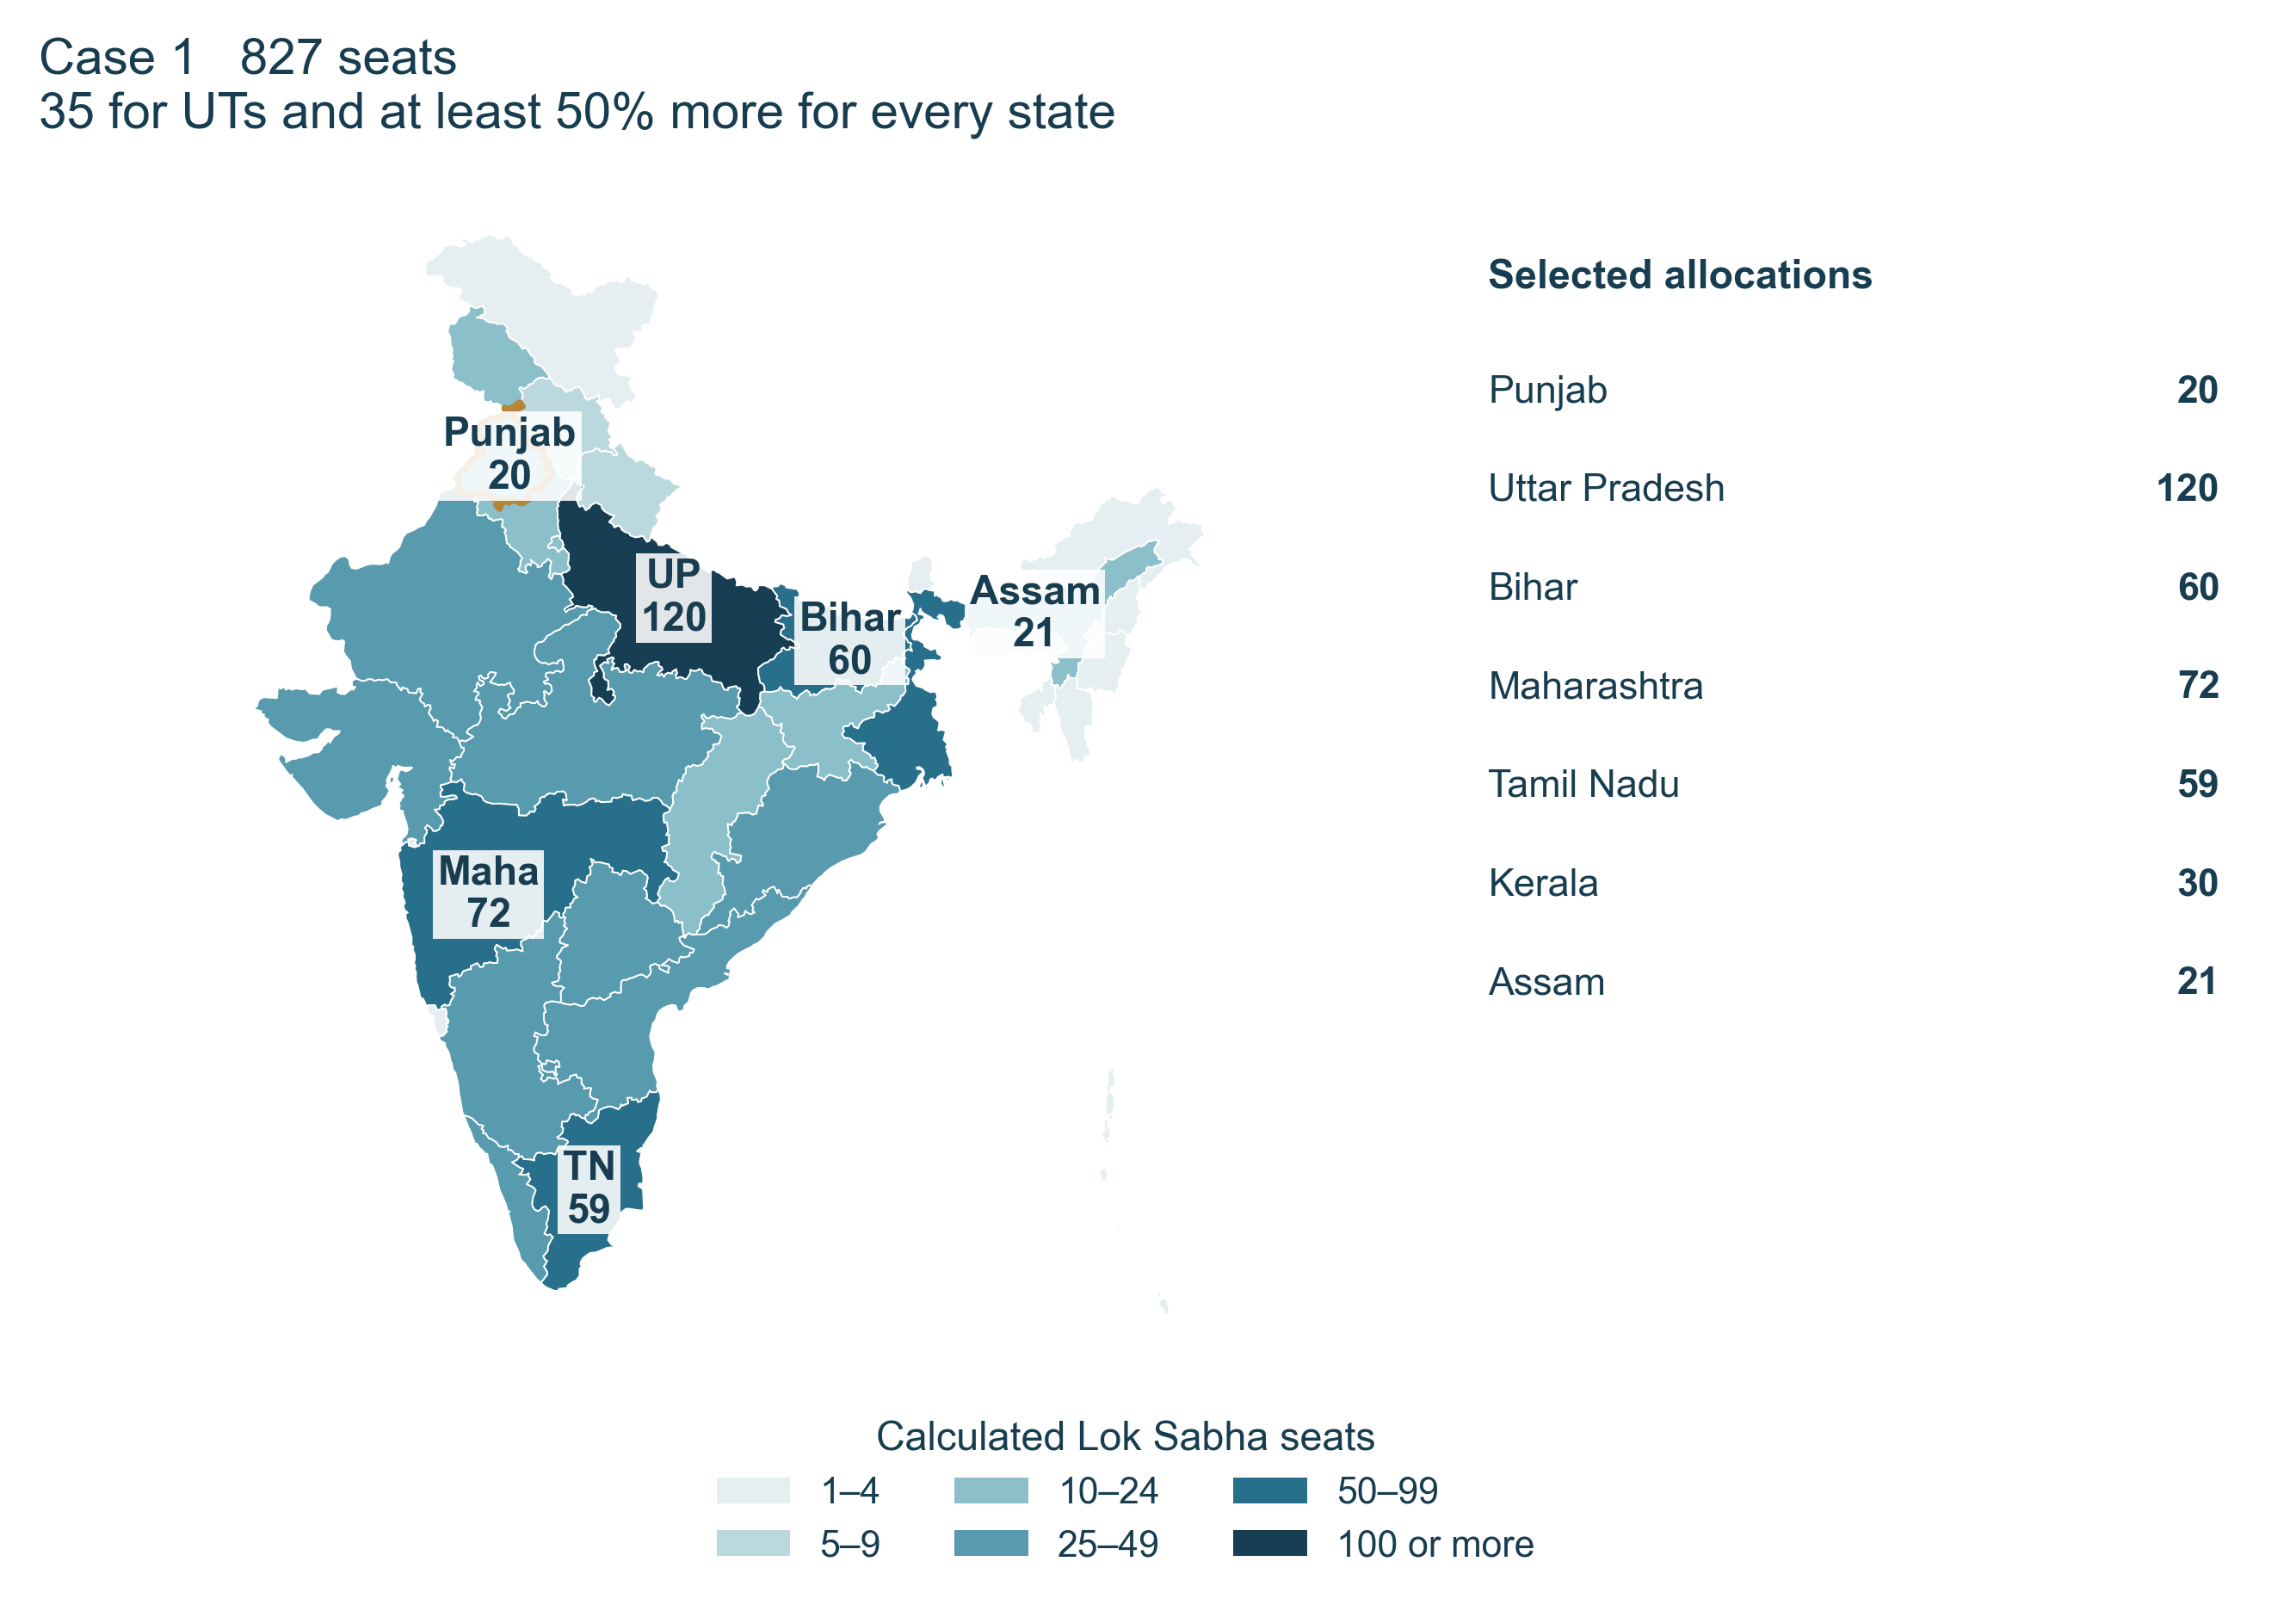
Case 1 is a Panj Teer reconstruction: 792 state seats plus a fixed UT pool of 35. State allocations rise by at least 50%; the internal UT split uses 2011 population with current seats protected. State and UT outlines are unchanged.
Within the UT pool, a second research rule is needed. This article divides the 35 using 2011 population while protecting each UT’s current seats. Whole-seat adjustments bring the pool to exactly 35. Delhi receives 16, Jammu and Kashmir 12, the merged Dadra and Nagar Haveli and Daman and Diu two, and each of the other five UTs one.
| Union Territory |
Current seats |
Case 1 illustration |
| Andaman And Nicobar Islands |
1 |
1 |
| Chandigarh |
1 |
1 |
| Dadra And Nagar Haveli And Daman And Diu |
2 |
2 |
| Delhi |
7 |
16 |
| Jammu And Kashmir |
5 |
12 |
| Ladakh |
1 |
1 |
| Lakshadweep |
1 |
1 |
| Puducherry |
1 |
1 |
The division of 35 is a Panj Teer population-based calculation with current seats protected. The bill did not contain this UT schedule.
The 50% minimum in this case applies to states. The UTs are allocated through their separate pool. This explains why a small UT can remain at one seat even though a state with one seat receives two. It also makes the method different from applying the same multiplier to all 36 existing allocations.
Case 2 using one population pool
The second calculation uses 2011 population to divide one pool of 850 among all 36 states and UTs. There is no separate 35-seat UT pool. Each population quota is calculated against the national population, while every unit’s current number of seats remains a minimum.
A quota will usually include a fraction. The calculation begins with its whole-number part or the current allocation, whichever is higher. It then adds seats to the largest shortfalls from quota until the total reaches 850. If protection of minimums places a pool above its target, the stated method removes seats from units above their minimums until the target is restored. The Excel file shows the steps.
The resulting total is 824 for states and 26 for UTs. Punjab receives 19, Uttar Pradesh 140, Bihar 73, Maharashtra 79, Tamil Nadu 50 and Kerala 23. None of the 36 current allocations is reduced in absolute terms. Some small allocations remain at their existing number.
The state total of 824 is above the April bill’s proposed 815 ceiling for states. This case is therefore an alternative framework, requiring a different state ceiling. It is not presented as a seat schedule mechanically produced by the bill as introduced.
The protection rule is applied during the division of the whole pool. A reader can see the initial quota, the minimum, the initial whole seats and the final adjustment for every unit in the calculation workbook, available on request. That is particularly useful for small units whose current representation is above their simple population quota.
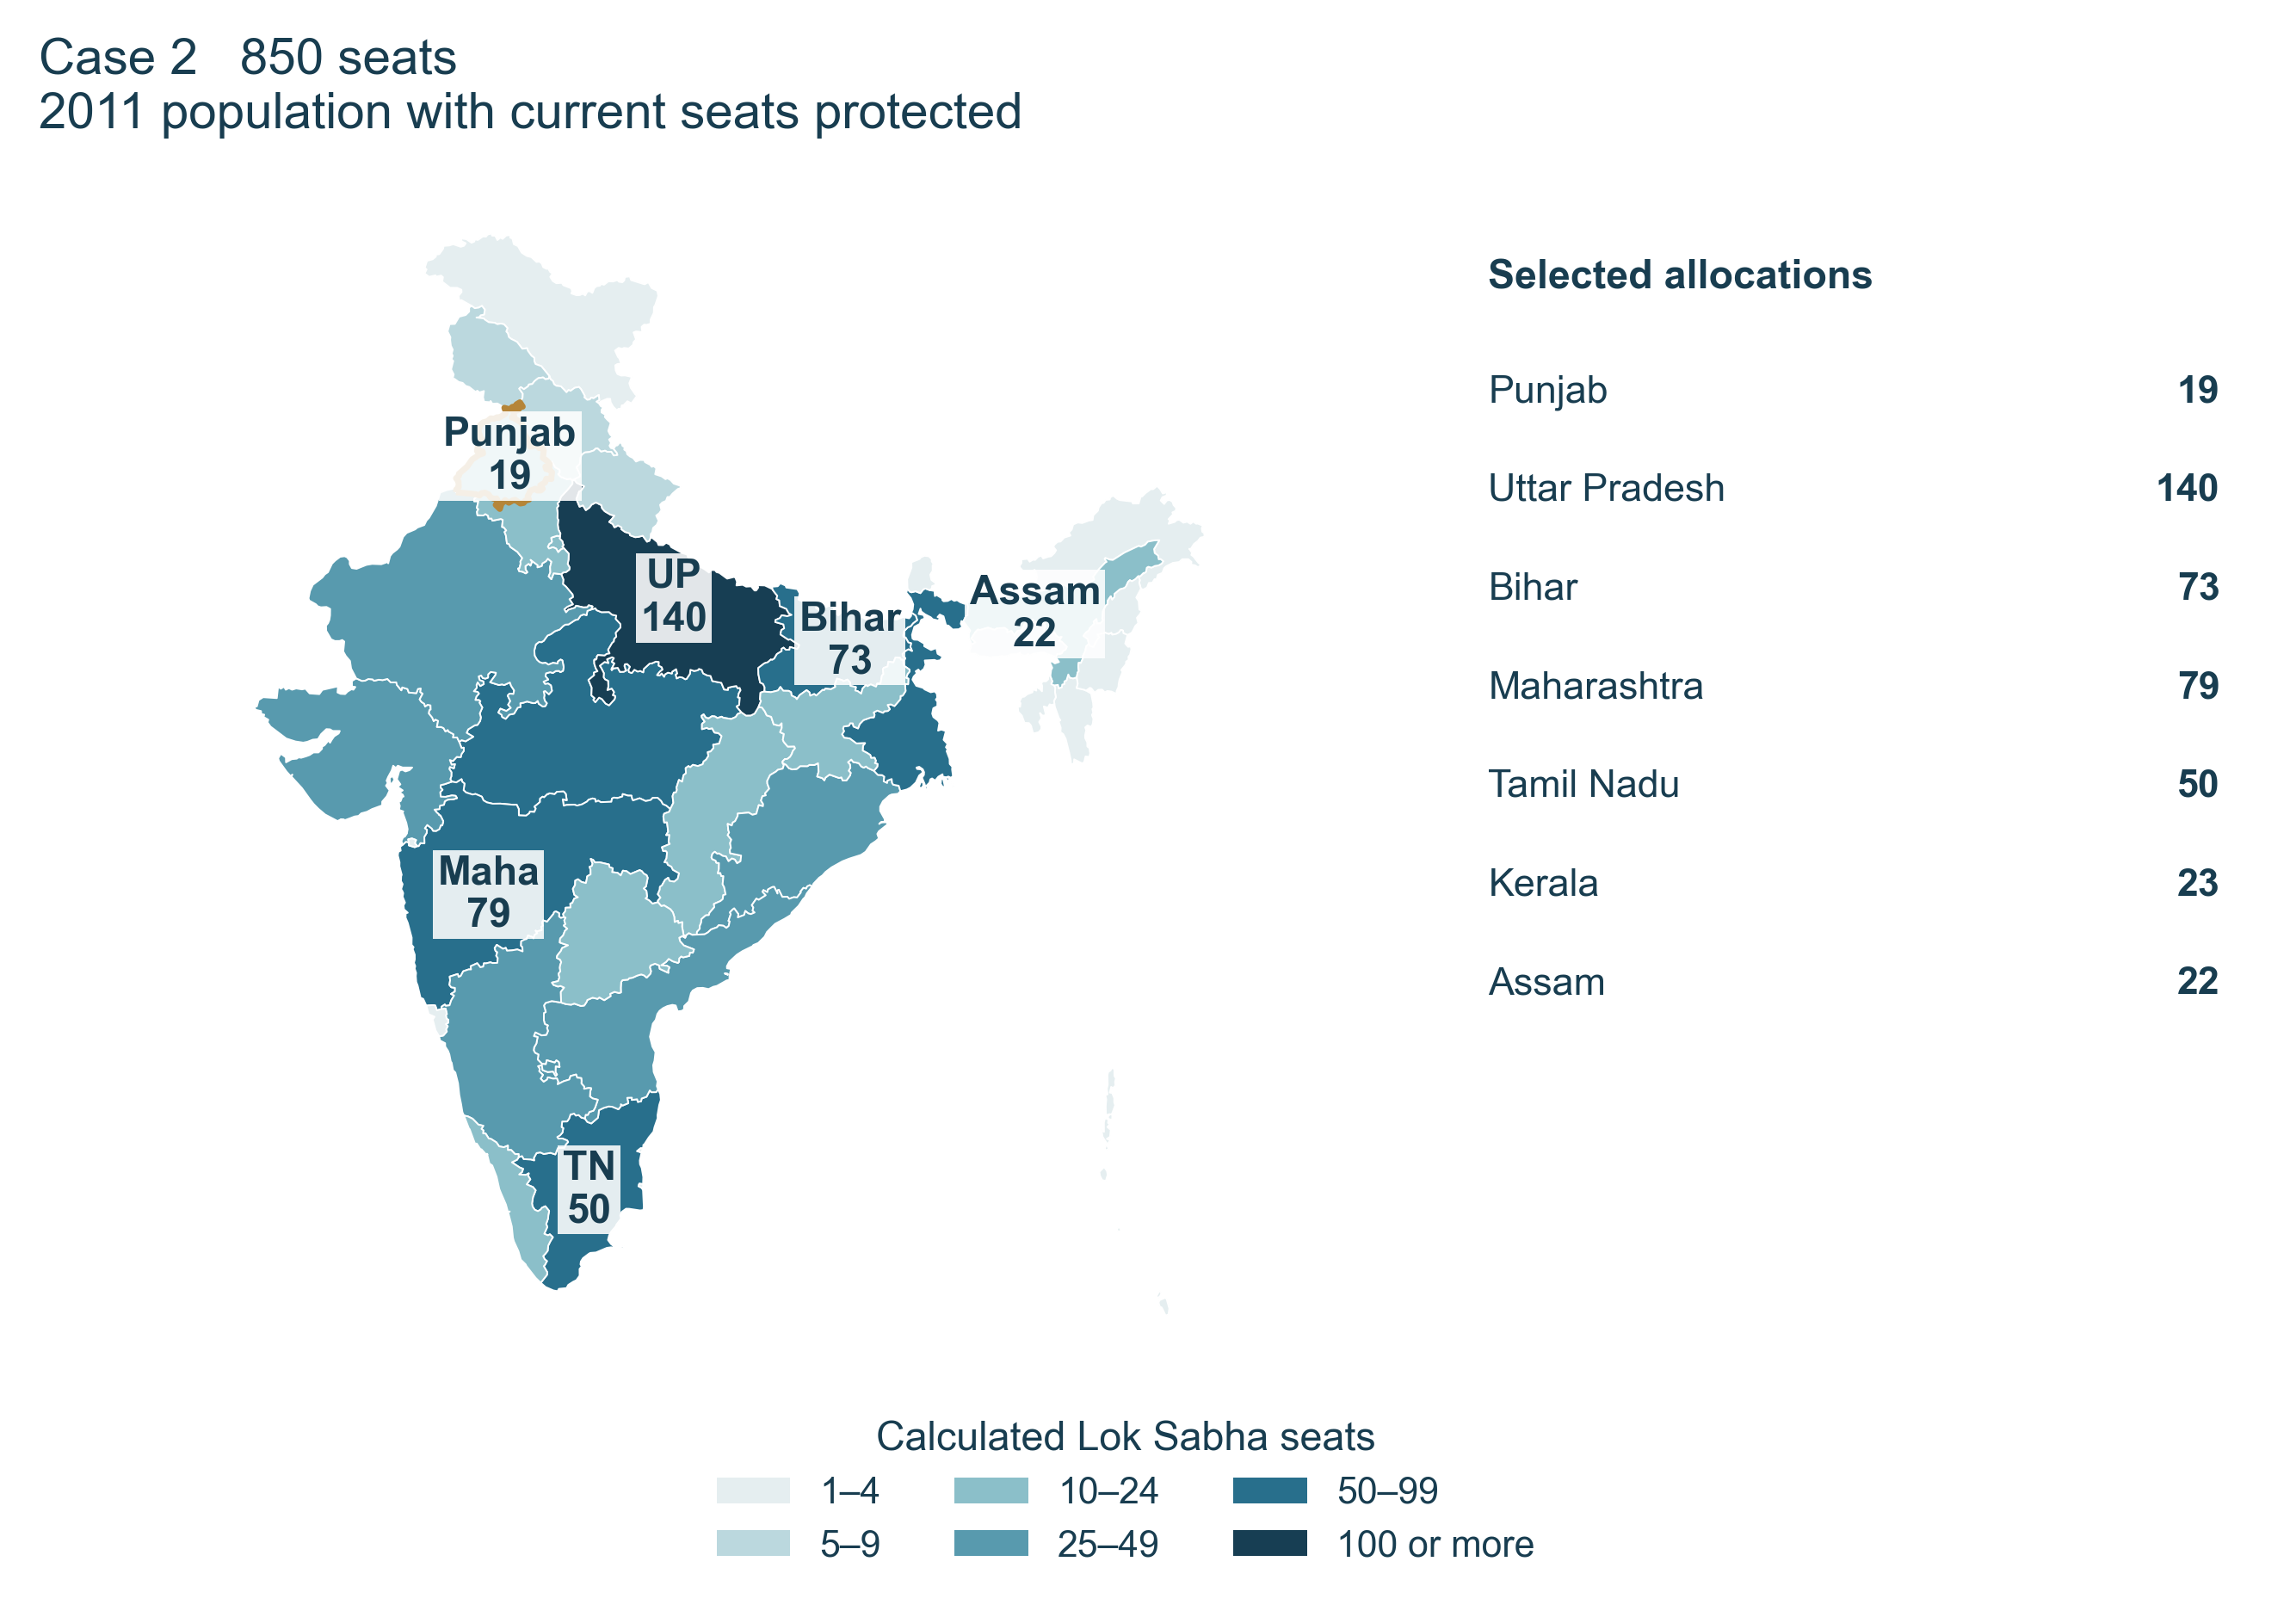
Case 2 divides 850 using 2011 population in one pool, with every current allocation protected. It produces 824 state seats and 26 UT seats, so it requires a different state ceiling from the April proposal. These are allocation figures, not new constituency boundaries.
Case 3 with a proportional increase
The third approach starts with existing seat allocations. It asks what happens when they are expanded by a common proportion. Population is not the allocation input in these two versions. They use the current division as their starting point, then deal with the fact that members must occupy whole seats.
In Case 3a, every state and UT allocation is multiplied by one and a half, with half-seats rounded upward separately. The result is 824 nationally: 792 state seats and 32 UT seats. Punjab receives 20. This uses the same state allocations as Case 1, but the UT total is 32 rather than 35.
A national increase of exactly half of 543 would include a half-seat. Separately rounding the allocations produces further differences. For this reason, the national total under the stated rule is 824. The label 50% describes the common multiplier before whole-seat rounding, not a claim that every final increase and the national increase are exactly 50%.
Case 3b expands to an exact total of 850 in proportion to existing seats. Each allocation is first multiplied by 850 divided by 543, about 1.5654. Whole seats are then assigned using the largest shortfalls from those quotas. The final total is 819 for states and 31 for UTs. Punjab receives 20.
Because 819 is above the proposed state ceiling of 815, Case 3b also requires a different ceiling. Its small percentage changes come from assigning whole seats. It should not be described as preserving every state’s precise percentage. For instance, Punjab’s 20 out of 850 is 2.35%, compared with its current 2.39%.
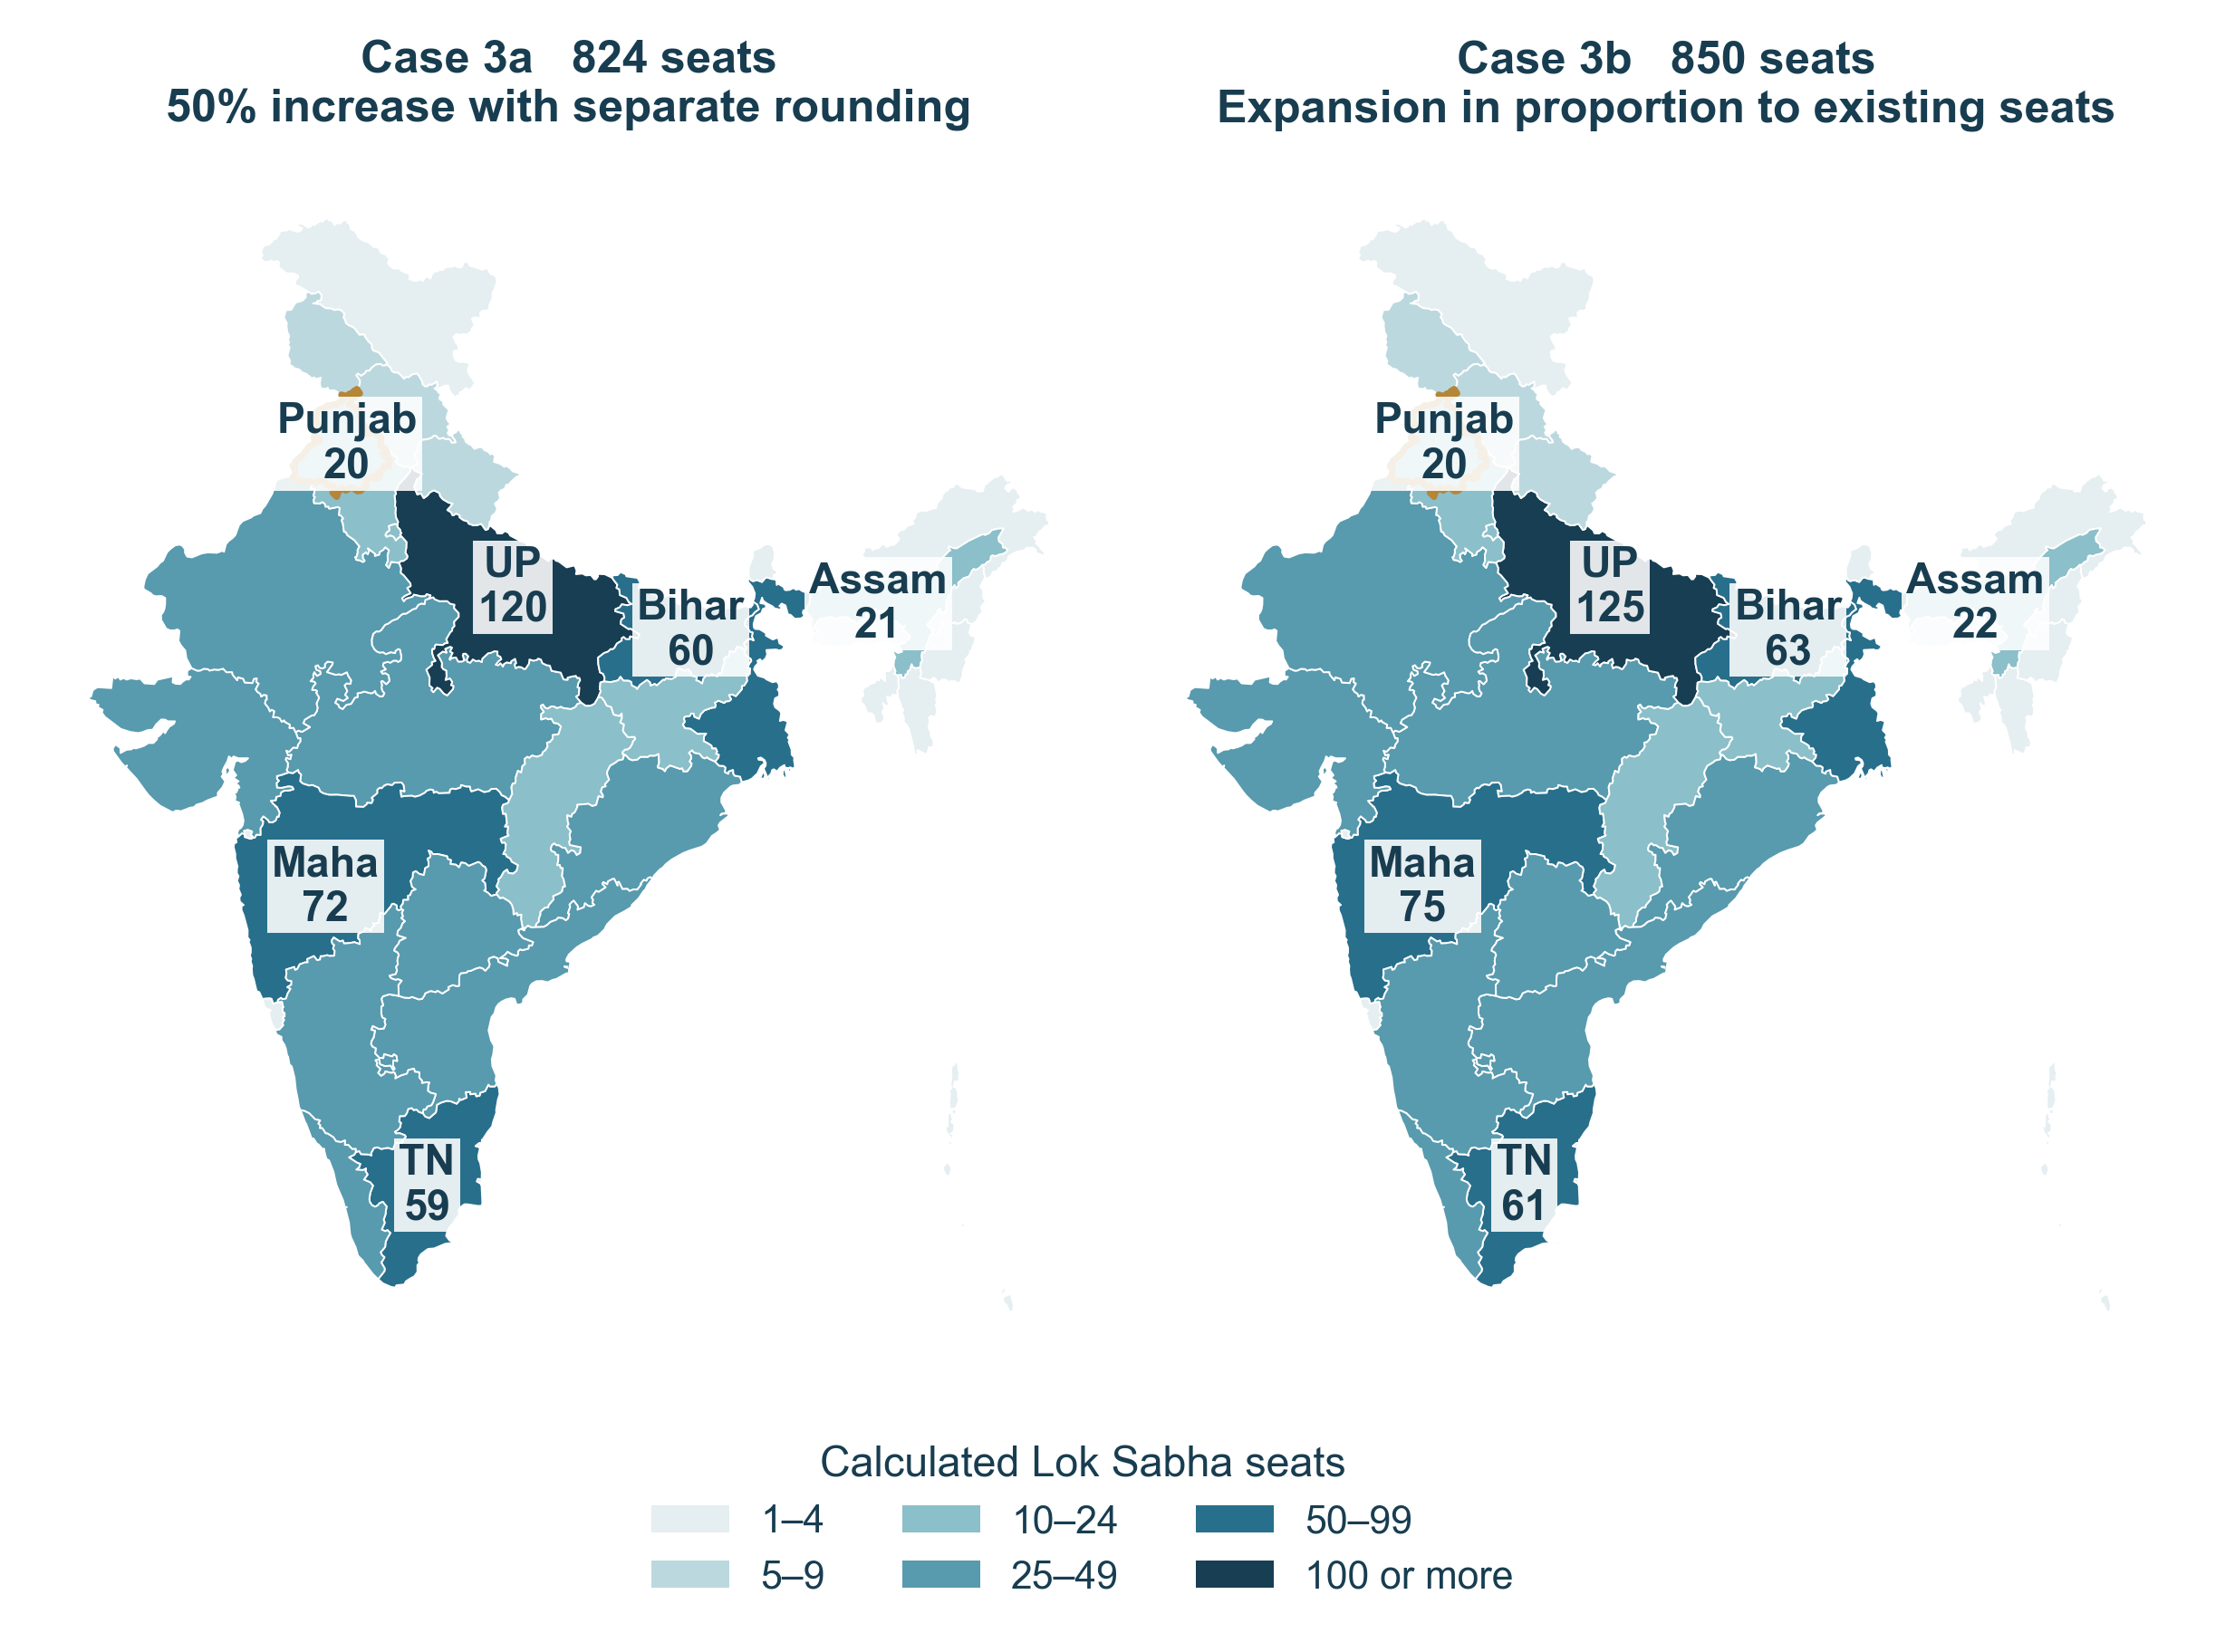
Case 3a scales all 36 allocations by 50% and rounds separately. Case 3b expands in proportion to existing seats to total exactly 850. Neither has a separate fixed UT pool of 35. All future figures are Panj Teer calculations.
| Arrangement |
India |
States |
UTs |
| Current |
543 |
524 |
19 |
| Case 1 |
827 |
792 |
35 |
| Case 2 |
850 |
824 |
26 |
| Case 3a |
824 |
792 |
32 |
| Case 3b |
850 |
819 |
31 |
All case columns follow the research rules above. The separately reported government illustration used 816.
The regional distribution
The comparisons use seven reporting groups. The nine Hindi-belt states are Uttar Pradesh, Bihar, Madhya Pradesh, Rajasthan, Jharkhand, Chhattisgarh, Haryana, Himachal Pradesh and Uttarakhand. Delhi stays with the UTs. The five southern states are Andhra Pradesh, Telangana, Karnataka, Kerala and Tamil Nadu. Puducherry also stays with UTs.
The Northeast includes Assam, Arunachal Pradesh, Manipur, Meghalaya, Mizoram, Nagaland, Sikkim and Tripura. Punjab is shown separately. Maharashtra, Gujarat and Goa form the western group; West Bengal and Odisha form the eastern group. The groups cover every unit once. They describe geography for this comparison, rather than the language or voting choices of every resident.
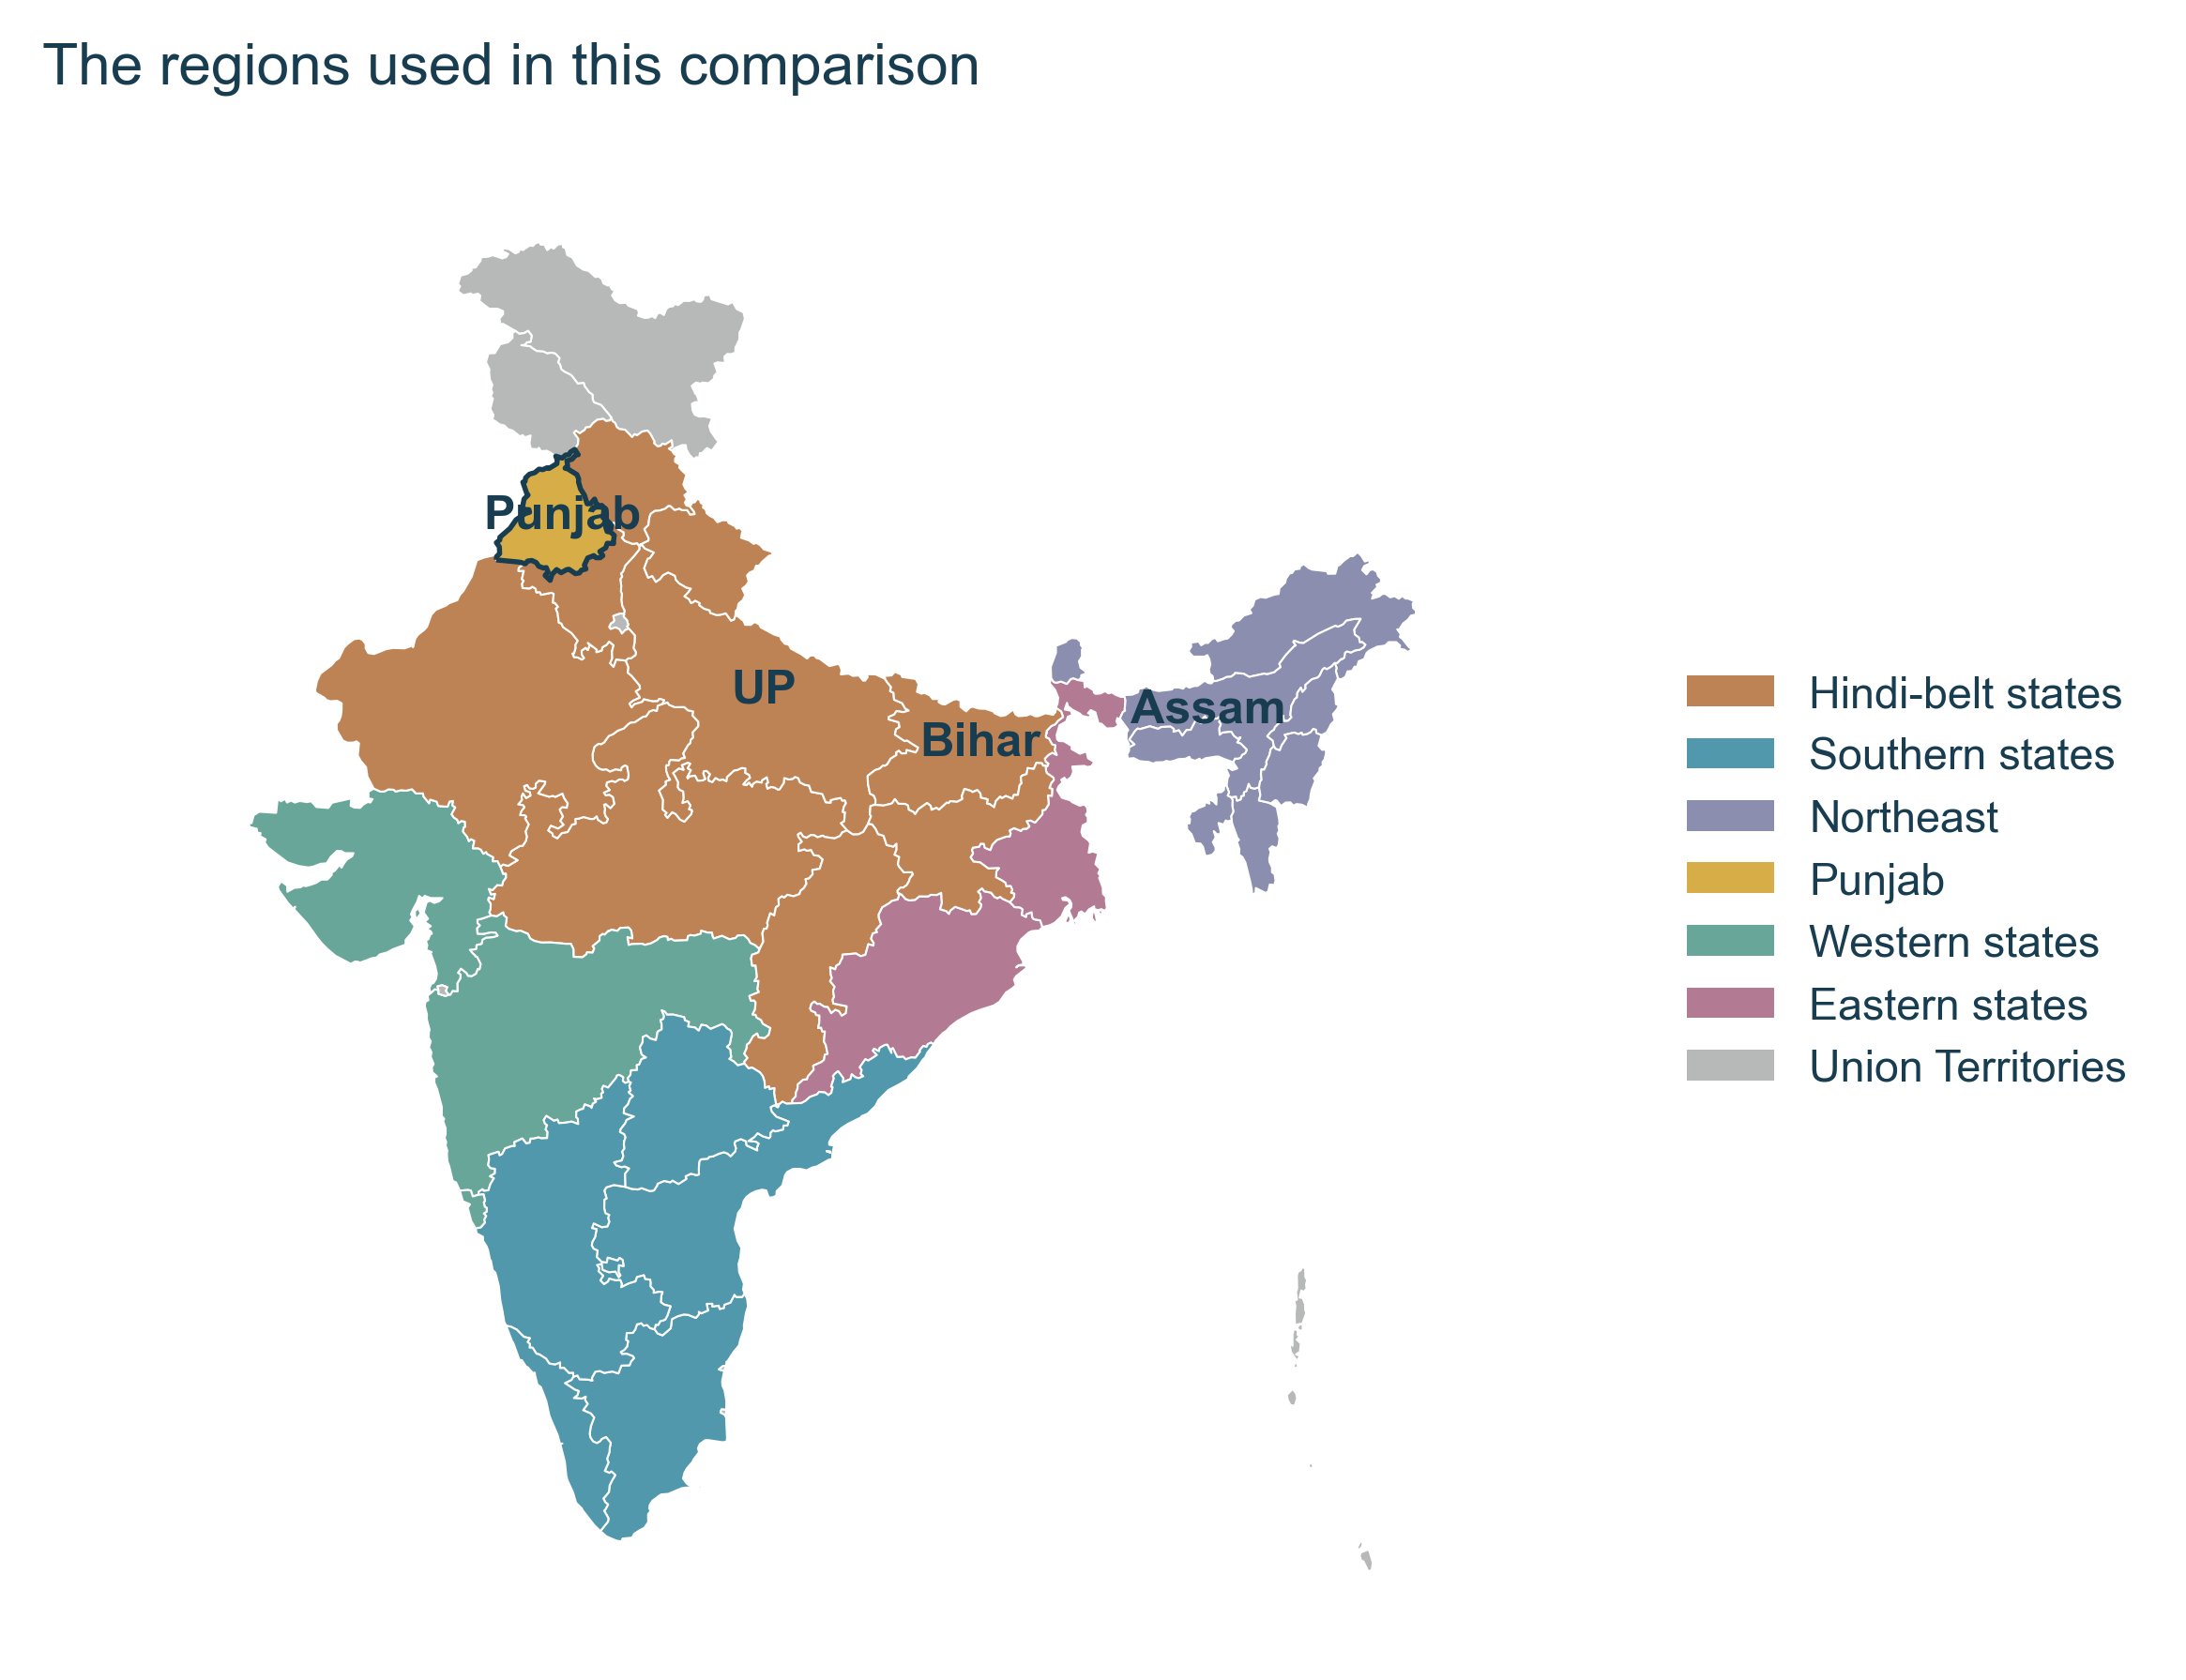
The reporting groups are defined in the text and calculation file. Delhi and Puducherry are included with UTs. Assam is included with the other seven Northeast states. Tiny UT outlines are easier to identify in the full allocation table.
| Region |
Current |
Case 1 |
Case 2 |
Case 3a |
Case 3b |
| Hindi-belt states (9) |
218 |
329 |
382 |
329 |
341 |
| Southern states (5) |
129 |
195 |
174 |
195 |
202 |
| Northeast (8) |
25 |
39 |
33 |
39 |
38 |
| Punjab |
13 |
20 |
19 |
20 |
20 |
| Western states (3) |
76 |
114 |
123 |
114 |
119 |
| Eastern states (2) |
63 |
95 |
93 |
95 |
99 |
| Union Territories (8) |
19 |
35 |
26 |
32 |
31 |
| India |
543 |
827 |
850 |
824 |
850 |
Regional seat counts. Each column adds to its own national total; the accompanying chart shows the corresponding shares.
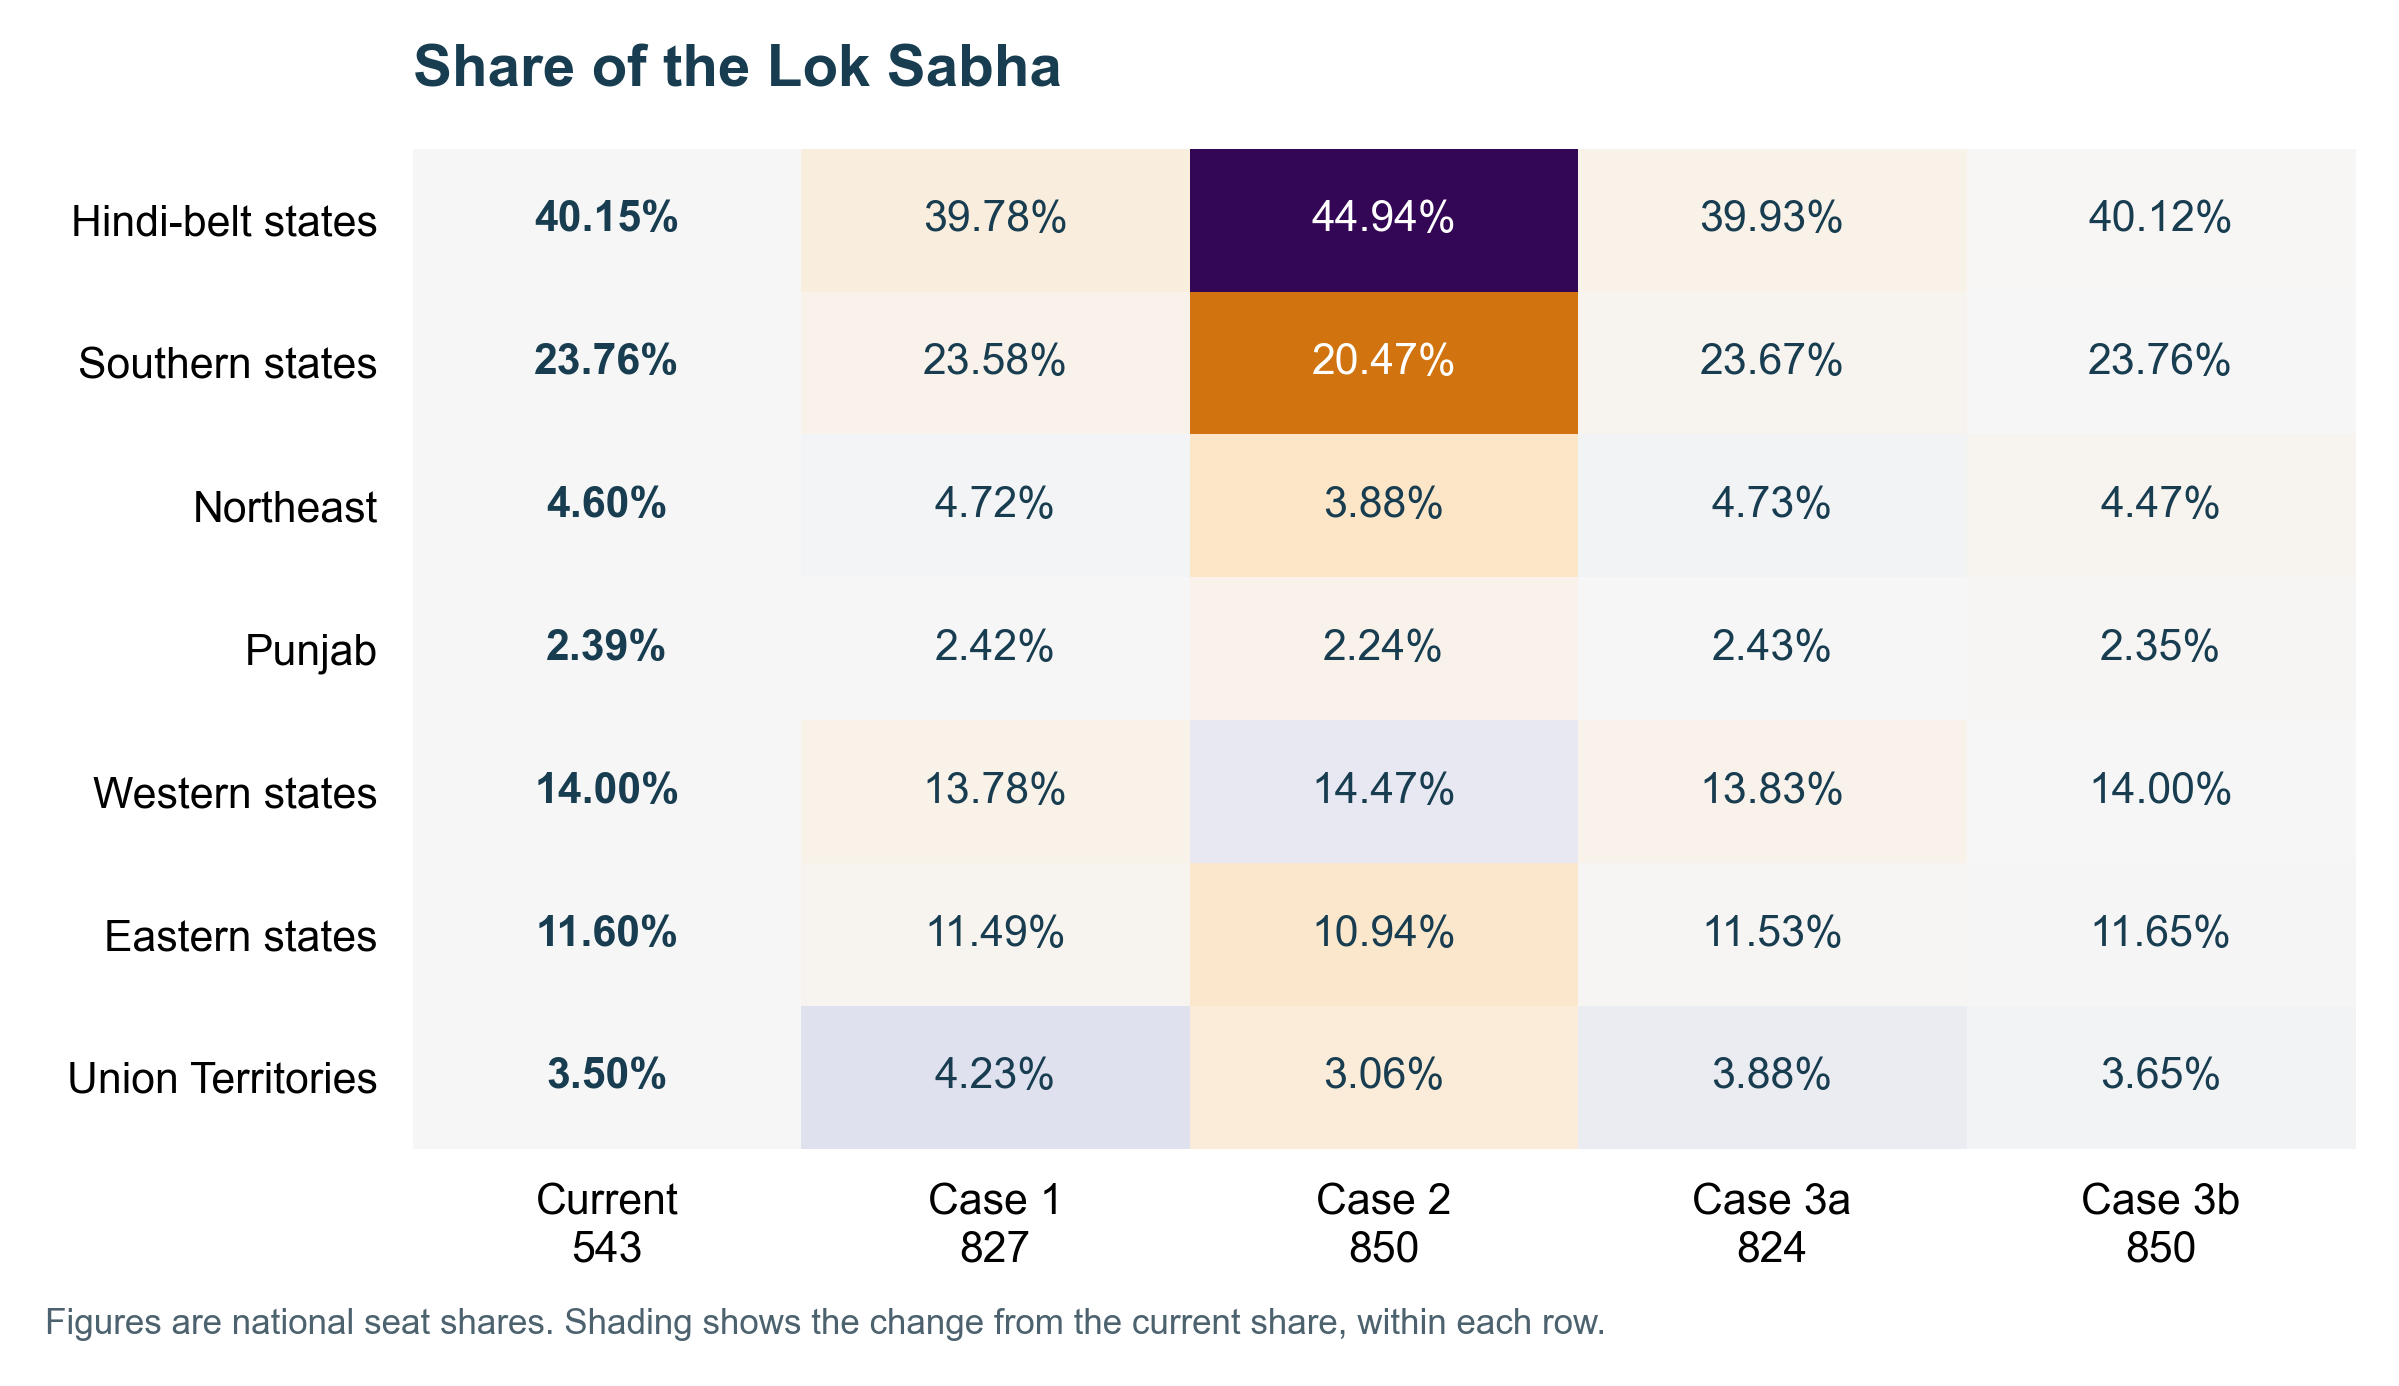
Every percentage uses that column’s national total. Purple shading indicates a larger share and orange a smaller share than the current allocation; colour does not express a judgment about desirability. All case results are conditional calculations.
In the population case, the nine Hindi-belt states form a larger share of the Lok Sabha. The South, Punjab and Northeast form smaller shares, even though their numbers of MPs increase. The Hindi-belt group moves from 218 of 543 seats to 382 of 850, or from 40.15% to 44.94%. The South moves from 129 to 174 seats, while its share changes from 23.76% to 20.47%.
The Northeast has 25 seats in the current allocation and 33 in the population case. Its national share changes from 4.60% to 3.88%. Assam receives 22 in that case. The other seven states together receive 11, including the allocations protected at their current minimums. The total for all eight is shown so that Assam is not accidentally left out of a Northeast comparison.
The separate UT pool is visible in Case 1. UTs hold 35 of 827 places, or 4.23%. Under Case 3a they hold 32 of 824, or 3.88%, while state seat counts are the same in the two calculations. The population case gives UTs 26 of 850, or 3.06%. These different denominators and pools are shown alongside the numbers.
Case 3b gives the nine Hindi-belt states 341 of 850, or 40.12%, and the South 202 of 850, or 23.76%. The Northeast receives 38, or 4.47%. The state-by-state table shows the whole-seat results, including cases where a single additional seat has a relatively large effect on a small state’s percentage increase.
Seats and decisions at the Centre
The Union government is collectively responsible to the Lok Sabha. Members there participate in government confidence and legislation. The House also has a distinct role in Money Bills. Representation in it is therefore part of the setting in which national decisions affecting states are made.[12]
The regional comparisons show the location of seats under each rule. They do not enter party vote totals, candidate choices or election results into the calculation. A regional total is the sum of its states’ allocations. The models do not assign all those MPs a common political position.
The difference between an absolute increase and a smaller national share can be read directly from the South’s population-case figures. There are 45 more seats, from 129 to 174, within a House that has grown by 307. Its share consequently changes by about 3.29 percentage points. Punjab’s corresponding change is from 2.39% to 2.24%.
Other institutions have their own arrangements. Punjab has seven allocated Rajya Sabha seats. A change to its Lok Sabha allocation does not, by itself, rewrite the Rajya Sabha schedule. Amendments affecting state representation in Parliament are also among those for which Article 368 provides a role for state ratification.[12][13]
This keeps two kinds of power change distinct. One concerns the representation of states and regions within the Lok Sabha. Another concerns which legal powers the Union and the states hold. The cases calculate the first. The history of constitutional and statutory changes below identifies particular mechanisms affecting the second.
Powers held by the Centre
The Constitution divides subjects among Union, State and Concurrent Lists. Parliament can make laws on Union subjects; both levels can make laws on Concurrent List subjects. Powers over subjects not named in the lists are called residuary powers. These law-making and taxing powers belong to Parliament, subject to the special GST provision.[12]
There are specified routes for Parliament to act in State List matters, including a qualifying Rajya Sabha resolution, an Emergency and legislation requested by states. Parliament can also legislate to implement international agreements. These routes have different conditions; they are not a general instruction that the State List disappears.[12]
The Constitution also allows Parliament to reorganise states. It provides for Union directions, Governors and emergencies. Each power has conditions and limits, set out in the relevant Articles. The references are collected in the notes.[12]
Changes such as moving education and forests into the Concurrent List, and bringing major indirect taxes into the GST system, have reduced states’ room to act independently in these fields. The mechanisms differ. One concerns a legislative field, another a common tax arrangement with powers exercised by both levels. The distinction is important when following the history.
Changes to law making powers
The 42nd Amendment changed specified entries in the Seventh Schedule. Education and forests moved into the concurrent field. The changes also concerned administration of justice, wildlife, and weights and measures. That gave Parliament a wider legislative field in those subjects while state legislatures continued to have powers there.[4]
If a Parliamentary law conflicts with a state law on a Concurrent List subject, the Parliamentary law generally prevails to the extent of the conflict. Article 254 allows certain state laws to apply in that state after Presidential assent. Parliament can still change the law later.[12]
An earlier example is the Third Amendment’s expansion of Concurrent List entry 33. Its enacted text includes trade, production, supply and distribution concerning specified commodities, including foodstuffs, cattle fodder, raw cotton and raw jute. It is a defined legislative change. It does not place every aspect of agriculture in the same category.[14]
How service tax developed
Service tax began in 1994 under the Finance Act. The Union used its residuary taxing power. The levy grew from a power it already held over taxes not specifically assigned elsewhere in the lists.[16]
The 88th Amendment sought a specific constitutional entry for taxes on services and a framework for collection and appropriation between the Union and states. Its statement of reasons records the existing Union use of residuary power and states’ demands to widen their tax base through services.[15]
There is a further detail often lost in a short timeline. The specific entry 92C introduced by that amendment was not notified before it was omitted through the 101st Amendment. The Supreme Court’s 2024 account identifies the Finance Act’s levy with the residuary entry. The existence of an enacted amendment and its operation are therefore separate matters in this example.[16]
The service-tax history belongs in a discussion of how an existing Union power was used in a new area of taxation. It is different from the transfer of a listed field such as forests. Both examples concern the distribution of authority, but they reached their positions through different legal routes.
What GST changed
The 101st Amendment in 2016 provided the constitutional framework for GST, introduced in 2017. It gave Parliament and state legislatures simultaneous powers to make GST laws, with Parliament holding exclusive power for inter-State supplies. The arrangement brought major indirect taxes into a common framework.[17][18]
That changed the setting in which a state could decide indirect-tax policy on its own. It also gave states a GST power covering services, while the Union entered the shared GST field for goods. These retained and gained powers are part of the account. Describing the change as the Union obtaining every taxing power would leave out the constitutional text.[17]
The GST Council provides a common forum for recommendations. When a proposal is put to a vote, the Union has one third of the voting weight and the states together have two thirds. A proposal needs at least three quarters of the weighted votes to pass. These weights do not depend on how many Lok Sabha members a state has.[18]
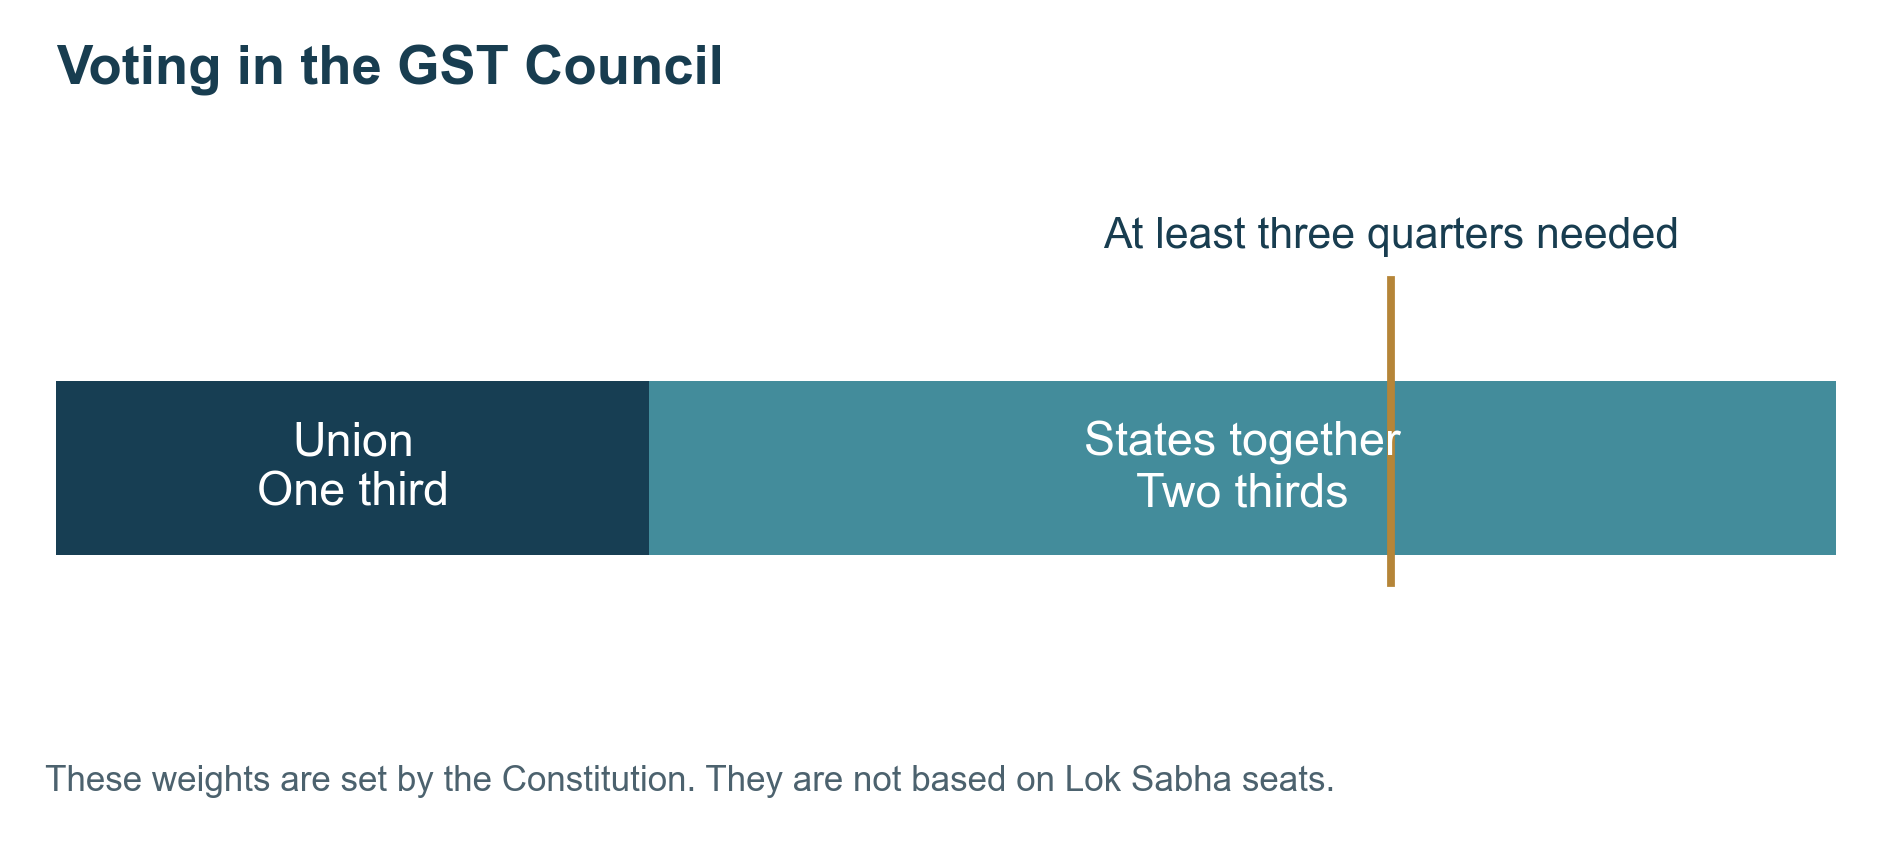
The Constitution sets the Council’s weighted-vote rule. It normally works through consensus; the displayed fractions describe a vote when one is taken. Council recommendations and legislative powers must also be read with the legal distinction explained below.
In Mohit Minerals in 2022, the Supreme Court held that Council recommendations do not bind Parliament and state legislatures when they pass GST laws. Where governments make rules under those laws, they must follow any requirement in the statute to act on a Council recommendation. The judgment keeps these two situations separate.[19]
| Field |
Earlier position |
Later arrangement |
| Education and forests |
Listed in the state field before the 42nd Amendment changes |
Concurrent law-making, with the constitutional conflict rule |
| Service tax |
Union levy using residuary taxing power from 1994 |
A later specific entry was not notified; GST then created a different framework |
| Major indirect taxes under GST |
Separate central and state levies |
Simultaneous GST powers, inter-State rules and Council recommendations |
These are different legal mechanisms. The table does not treat them as a transfer of every state power.
Revenue and investigations
Revenue has its own rules. Specified-purpose cesses and surcharges are excluded from the divisible pool—the taxes shared between the Union and states. This describes which revenue is shared. Measuring changes in the use of cesses and surcharges over time would require a separate comparison of government accounts.[12]
There are statutory mechanisms as well as constitutional amendments. Under the NIA Act, the Union can direct the Agency to investigate a scheduled offence through the Act’s process. Section 6 sets out the route, including directions to hand over the relevant investigation. The power concerns the offences and conditions covered by that law; it is not a transfer of every state police function.[20]
The changes have taken different routes: amending the legislative lists, using an existing taxing power, creating GST’s common framework, and legislating for specified investigations. Their legal bases and limits differ. Alongside this history, the seat comparisons show how each allocation rule changes representation in the Lok Sabha.
Punjab in the Lok Sabha
Punjab’s 2011 population in the calculation is 2,77,43,338. Its current allocation is 13 MPs. In Case 1 it receives 20 because 19.5 is rounded upward to meet the state minimum increase. In Case 2 its population-based quota in the national pool gives 19 after whole-seat allocation and protection of all current seats.
Case 3a also gives Punjab 20, while Case 3b gives it 20 within a larger House of 850. The same number of Punjab MPs can therefore sit in Houses of different sizes. Twenty of 827 is 2.42%; twenty of 824 is 2.43%; twenty of 850 is 2.35%. The comparison needs the national denominator next to the Punjab count.
| Arrangement |
Punjab MPs |
National seats |
Punjab share |
| Current |
13 |
543 |
2.39% |
| Case 1 |
20 |
827 |
2.42% |
| Case 2 |
19 |
850 |
2.24% |
| Case 3a |
20 |
824 |
2.43% |
| Case 3b |
20 |
850 |
2.35% |
Future rows are research calculations. They do not identify new Punjab parliamentary boundaries.
These are three allocation approaches, rather than competing population forecasts. Cases 1 and 3a start from existing seats; Case 2 uses 2011 population; Case 3b scales existing seat shares to a fixed House size. A different population year, protection rule or state ceiling would create another calculation and would need its own label.
The distribution within Punjab is a further task. A state allocation of 19 or 20 would still require the lawful boundary process to define the constituencies. Neither a state population quota nor a district’s name can decide by itself which villages and wards would be grouped into a new parliamentary seat. The maps here retain existing state outlines for the national comparisons.
Punjab’s Assembly is a separate calculation
Punjab currently has 117 Assembly seats. Dividing 117 by its 13 Lok Sabha seats gives nine. The future Assembly examples in this article retain that statewide ratio. They are conditional calculations, not a claim that a future Commission must keep nine or that every legal framework requires that particular number.
With nine retained, the 20 Lok Sabha seats in Cases 1, 3a and 3b give an Assembly of 180. The 19 Lok Sabha seats in Case 2 give 171. The April bill proposed a whole-number multiple, but it did not fix nine. The choice of multiple remains visible beside the examples and is an editable assumption in the Excel file.[8]
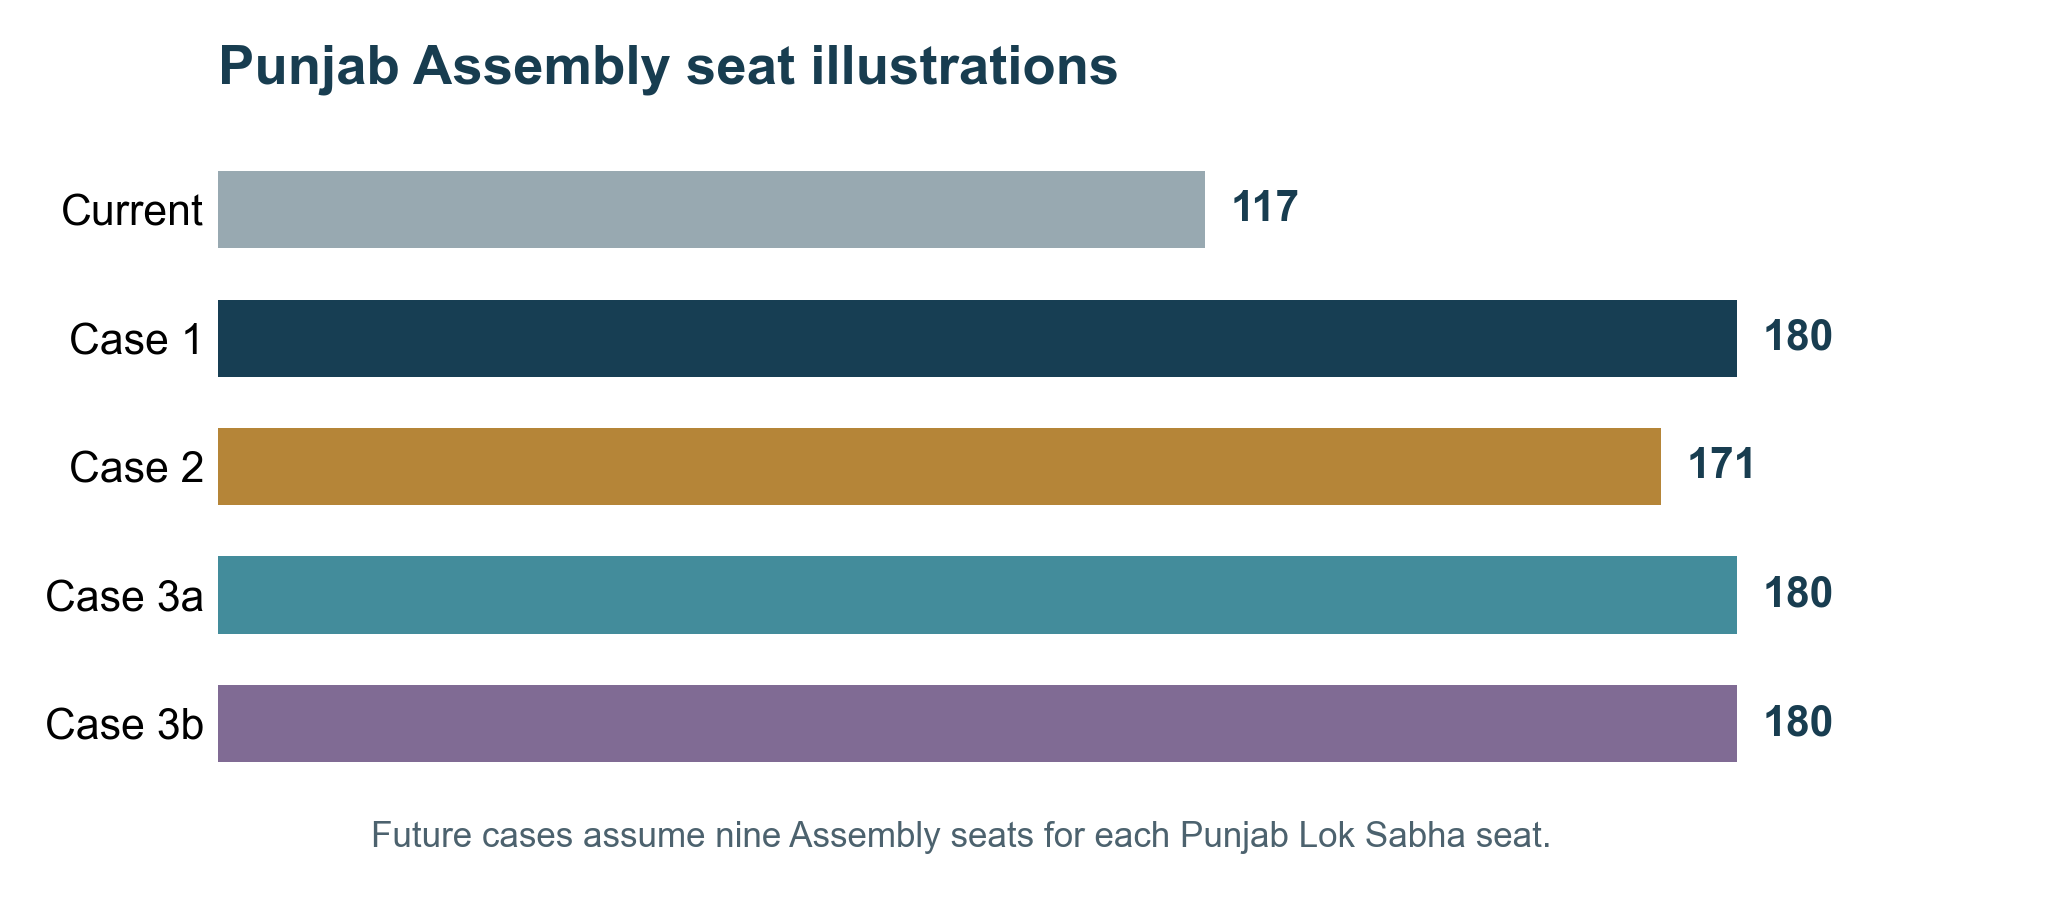
Only 117 is the current Assembly allocation. The future figures assume nine Assembly seats per Punjab Lok Sabha seat. They do not choose future boundaries or reserved constituencies.
Increasing the Assembly total and reallocating constituencies within Punjab are different stages. The first fixes the number of MLAs to be elected. The second draws the territory from which each MLA is elected. A comparison of district population shares can inform the discussion, but it is not a Commission’s order assigning a fixed district entitlement.
The boundary stage must account for the lawful population basis, geographic conditions, administrative units, communication and public convenience. Under the April proposal, each Assembly constituency would lie wholly inside a parliamentary constituency. Reserved-seat questions would also be dealt with under the applicable provisions. This calculation does not select a future reserved seat.[8]
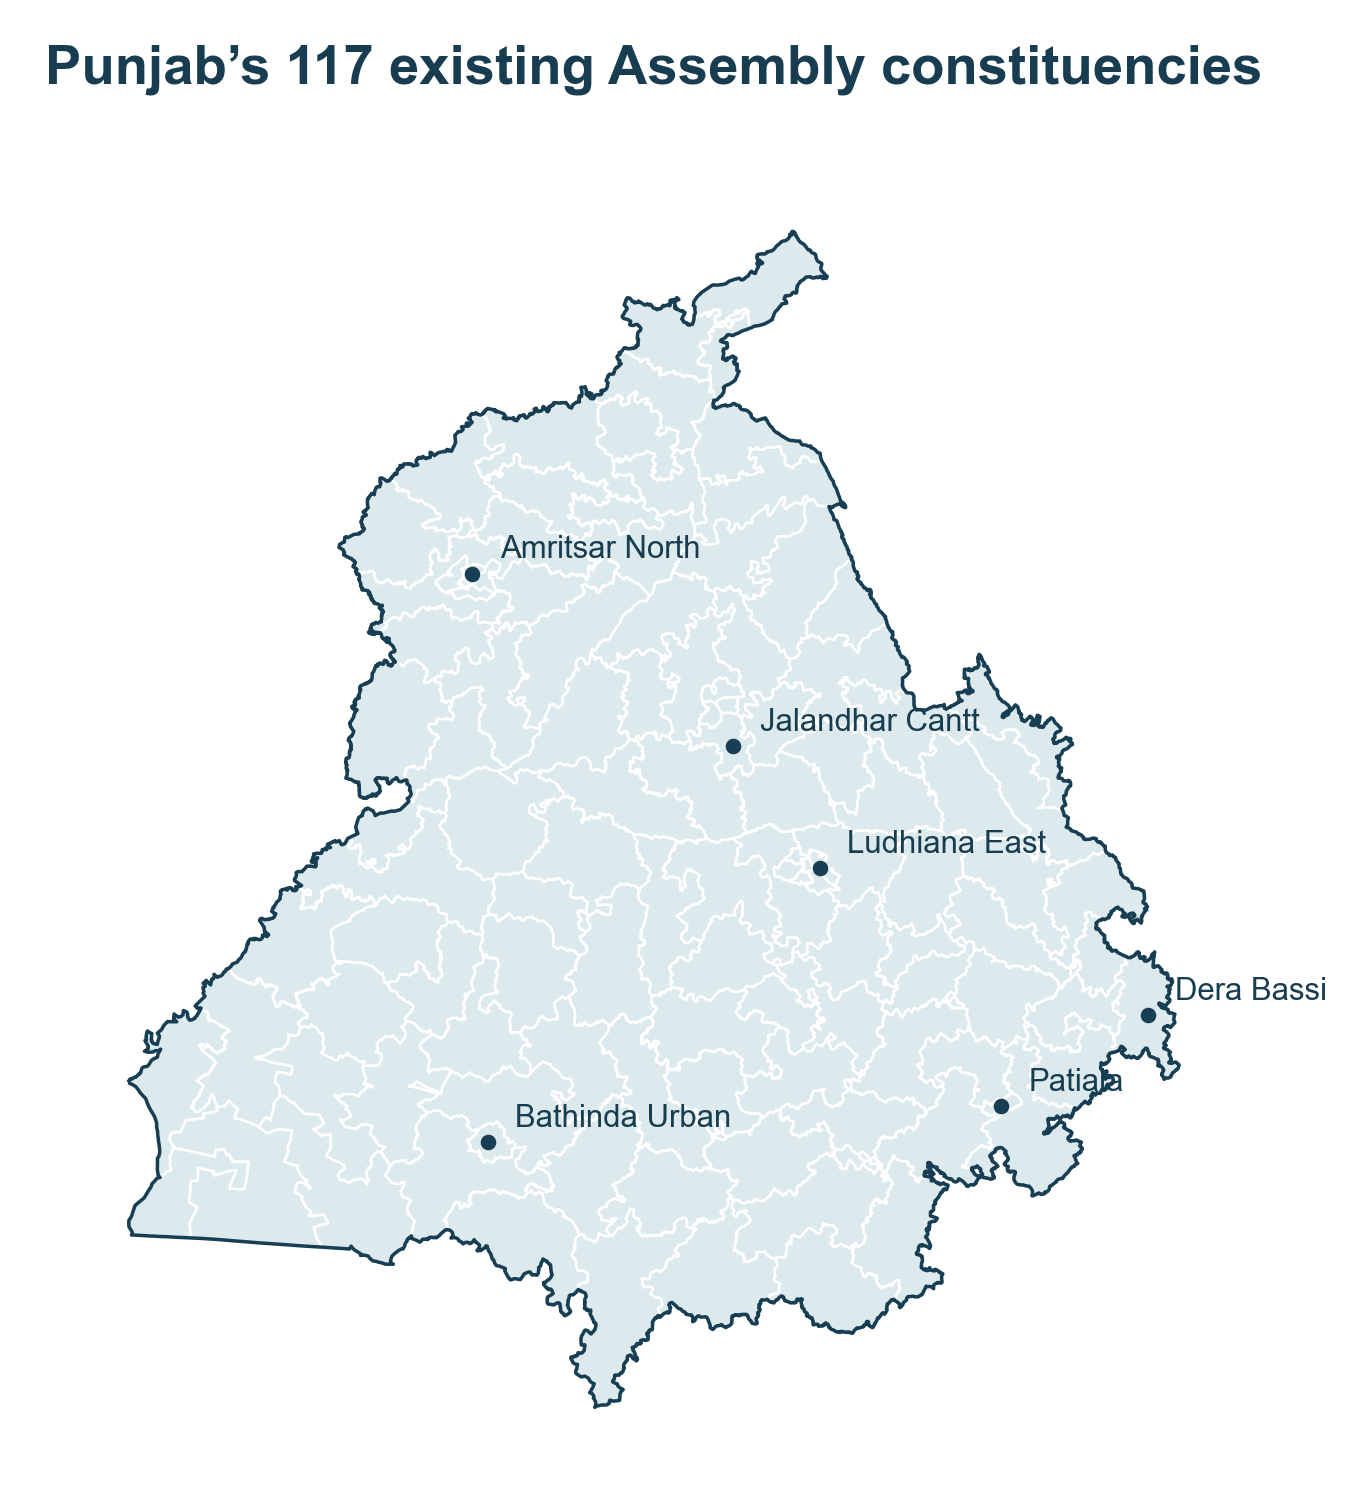
Reference map of the 117 existing Assembly constituencies, using the supplied outlines. Selected constituencies are labelled for location. This is not a proposed map for 171 or 180 seats.
District comparisons also need matching geography. Punjab’s 2011 Census districts and later administrative districts are not interchangeable without reconstruction. A figure for an older district cannot simply be placed in every district carved from it. The same care applies when a town, tehsil or Assembly boundary includes only part of another area.
The district illustrations below keep the 2011 Census groups together so that the population and seat comparisons cover the same broad areas. The existing-constituency map above provides a reference for location.
Punjab district Assembly seat illustrations
Panj Teer’s district calculation divides each statewide total in proportion to the 2011 population. The 171-seat version corresponds to Case 2 with the assumed multiple of nine. The 180-seat version corresponds to Cases 1, 3a and 3b with that same multiple. These are population-based illustrations within Punjab, not announced district allocations.
The figures use 20 Census district groups. Gurdaspur includes Pathankot, Firozpur includes Fazilka, and Sangrur includes Malerkotla. Current Assembly seats are added together on that same grouping. Separate figures for the later districts are not assigned from their parent district’s total.
Each district first receives the whole-number part of its population quota. The remaining seats go to the largest fractions until the statewide total is exactly 171 or 180. The Excel file shows the population, quota, fraction and final seat number for every group.
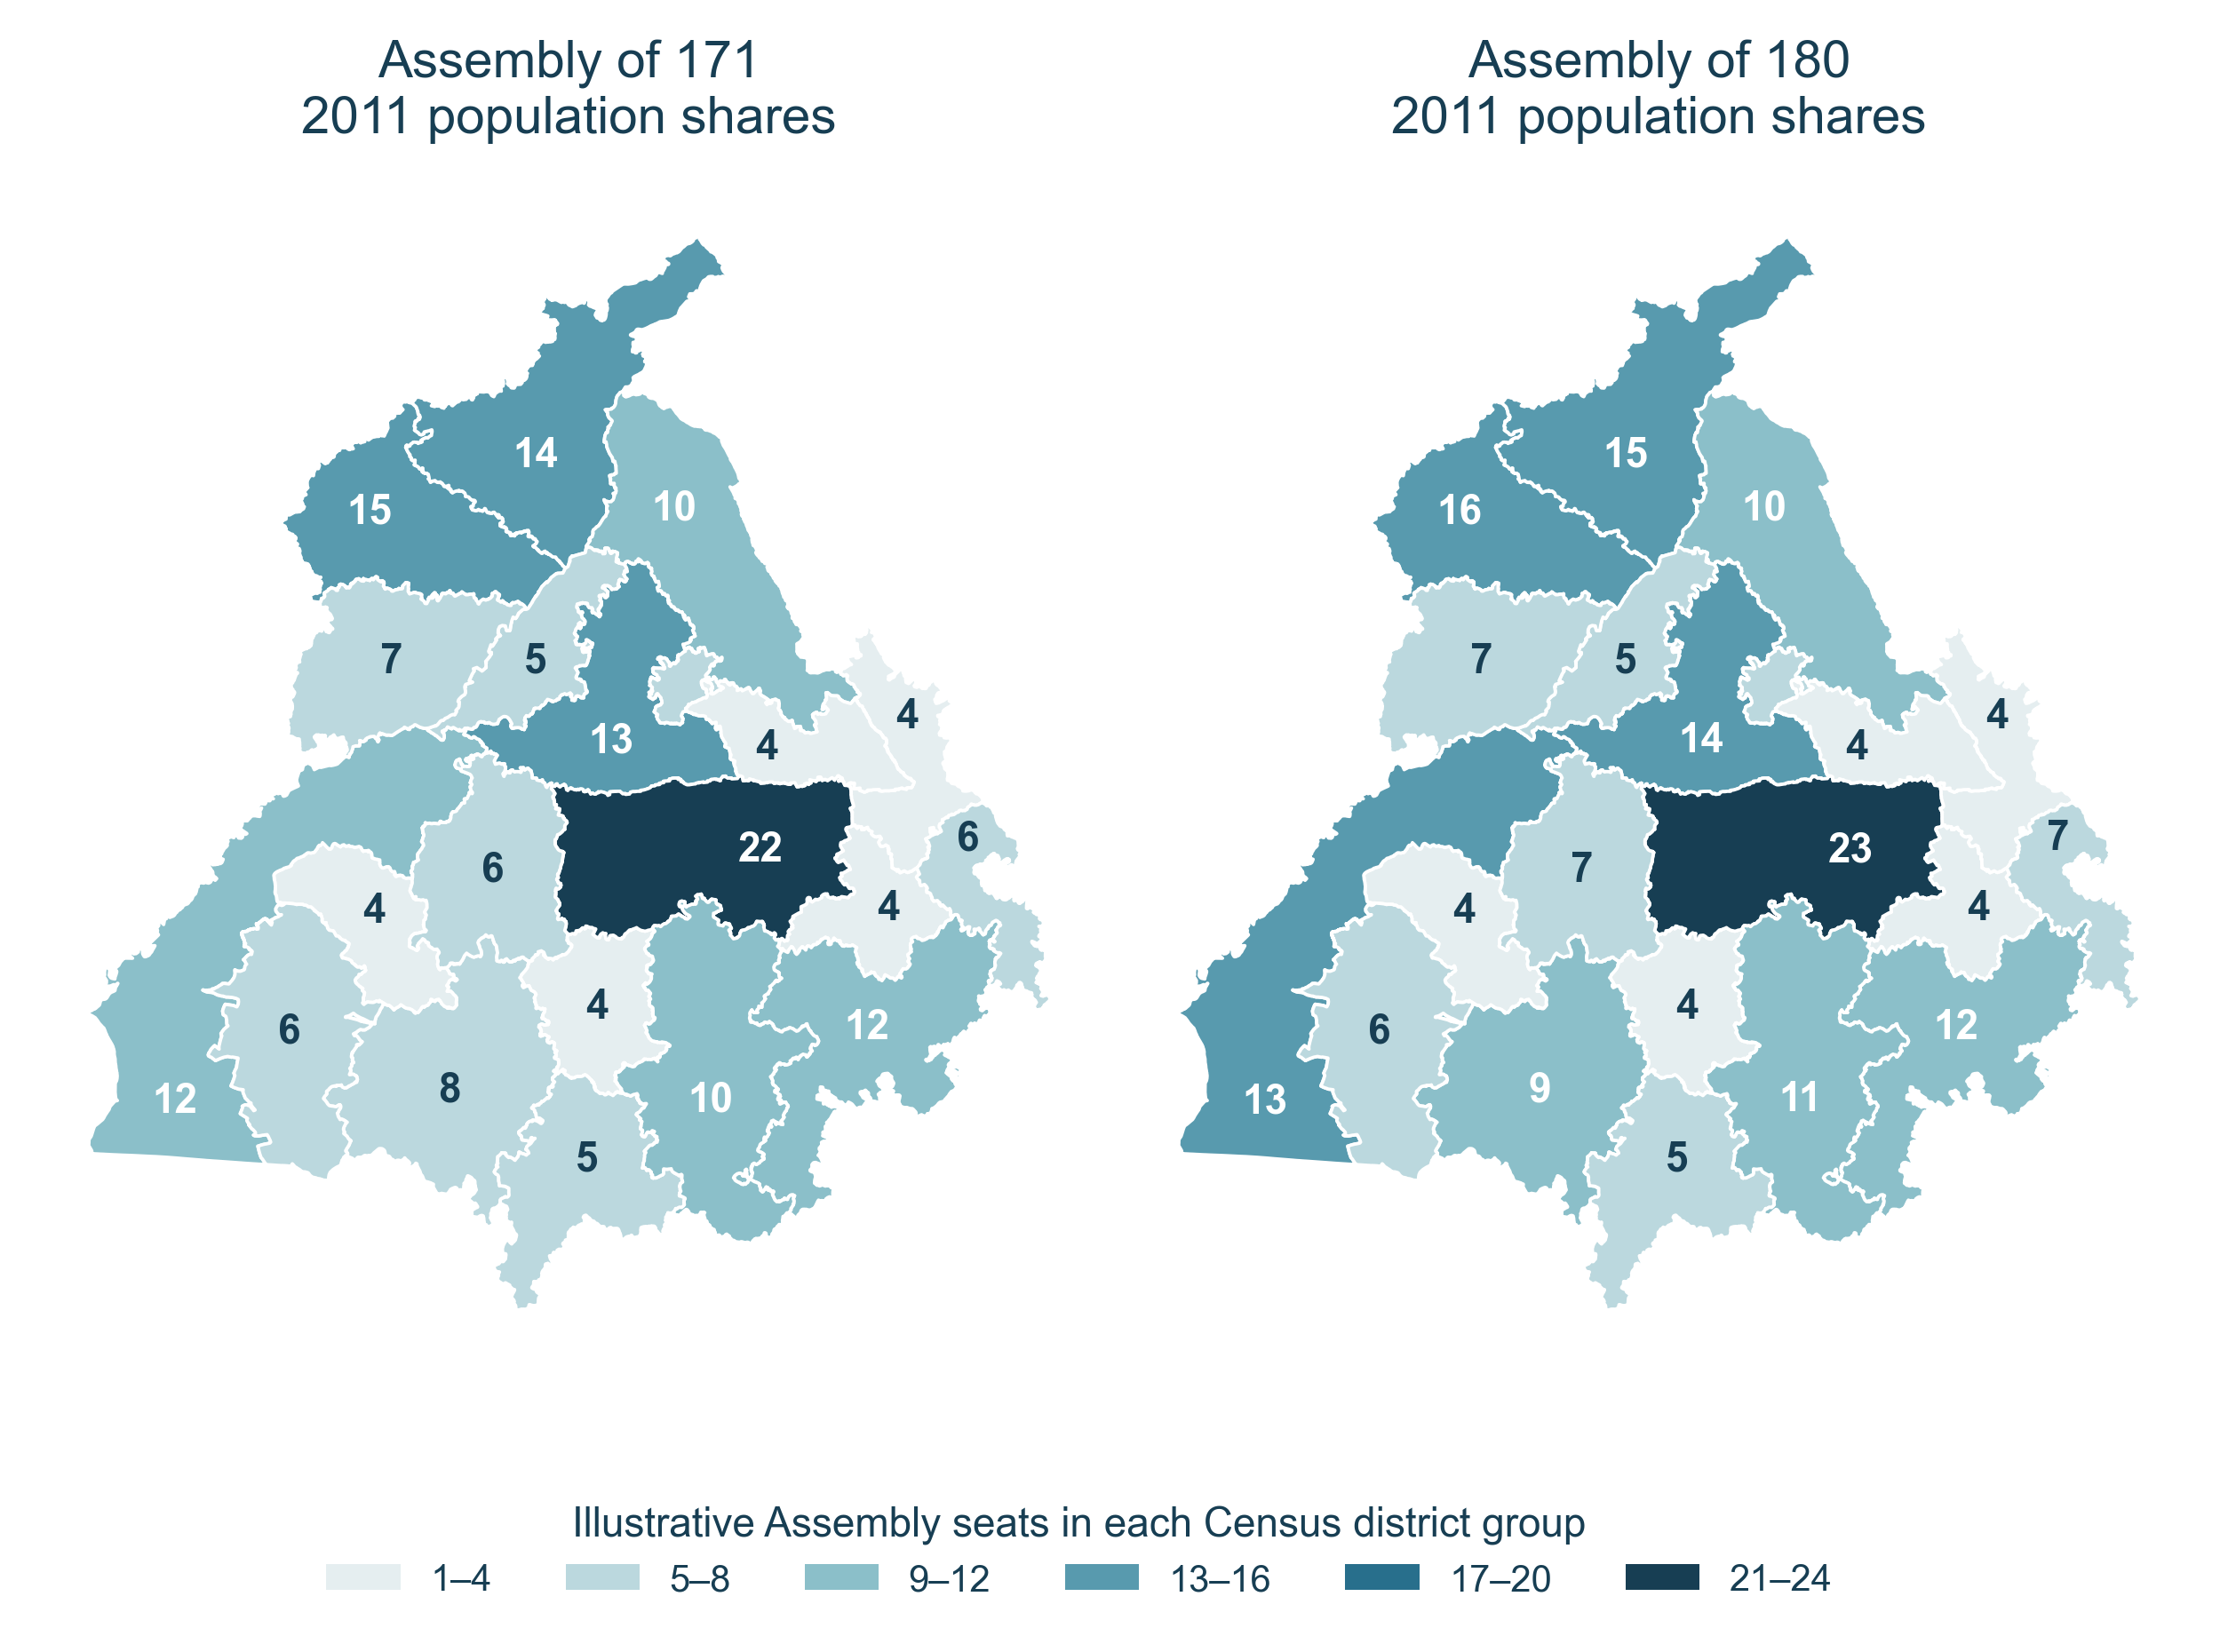
Both maps use 20 Census district groups and 2011 population shares. Numbers show illustrative Assembly seats. The outlines join modern district shapes for illustration; they are not future constituency boundaries.
| 2011 district group |
2011 population |
Current seats |
If total is 171 |
If total is 180 |
| Amritsar |
2,490,656 |
11 |
15 |
16 |
| Barnala |
595,527 |
3 |
4 |
4 |
| Bathinda |
1,388,525 |
6 |
8 |
9 |
| Faridkot |
617,508 |
3 |
4 |
4 |
| Fatehgarh Sahib |
600,163 |
3 |
4 |
4 |
| Firozpur + Fazilka |
2,029,074 |
8 |
12 |
13 |
| Gurdaspur + Pathankot |
2,298,323 |
10 |
14 |
15 |
| Hoshiarpur |
1,586,625 |
7 |
10 |
10 |
| Jalandhar |
2,193,590 |
9 |
13 |
14 |
| Kapurthala |
815,168 |
4 |
5 |
5 |
| Ludhiana |
3,498,739 |
14 |
22 |
23 |
| Mansa |
769,751 |
3 |
5 |
5 |
| Moga |
995,746 |
4 |
6 |
7 |
| Sri Muktsar Sahib |
901,896 |
4 |
6 |
6 |
| Patiala |
1,895,686 |
8 |
12 |
12 |
| Rupnagar |
684,627 |
3 |
4 |
4 |
| SAS Nagar |
994,628 |
3 |
6 |
7 |
| Sangrur + Malerkotla |
1,655,169 |
7 |
10 |
11 |
| SBS Nagar |
612,310 |
3 |
4 |
4 |
| Tarn Taran |
1,119,627 |
4 |
7 |
7 |
| Punjab |
27,743,338 |
117 |
171 |
180 |
Current seats total 117. Future columns divide the stated Assembly totals using 2011 population shares and whole seats. The three combined groups retain their later districts.
Under this method, Ludhiana has 22 seats in the 171-seat illustration and 23 in the 180-seat version, against 14 currently. SAS Nagar has six or seven, against three. Amritsar has 15 or 16, against 11; Jalandhar has 13 or 14, against nine. These are results of the stated calculation using the historical population shares.
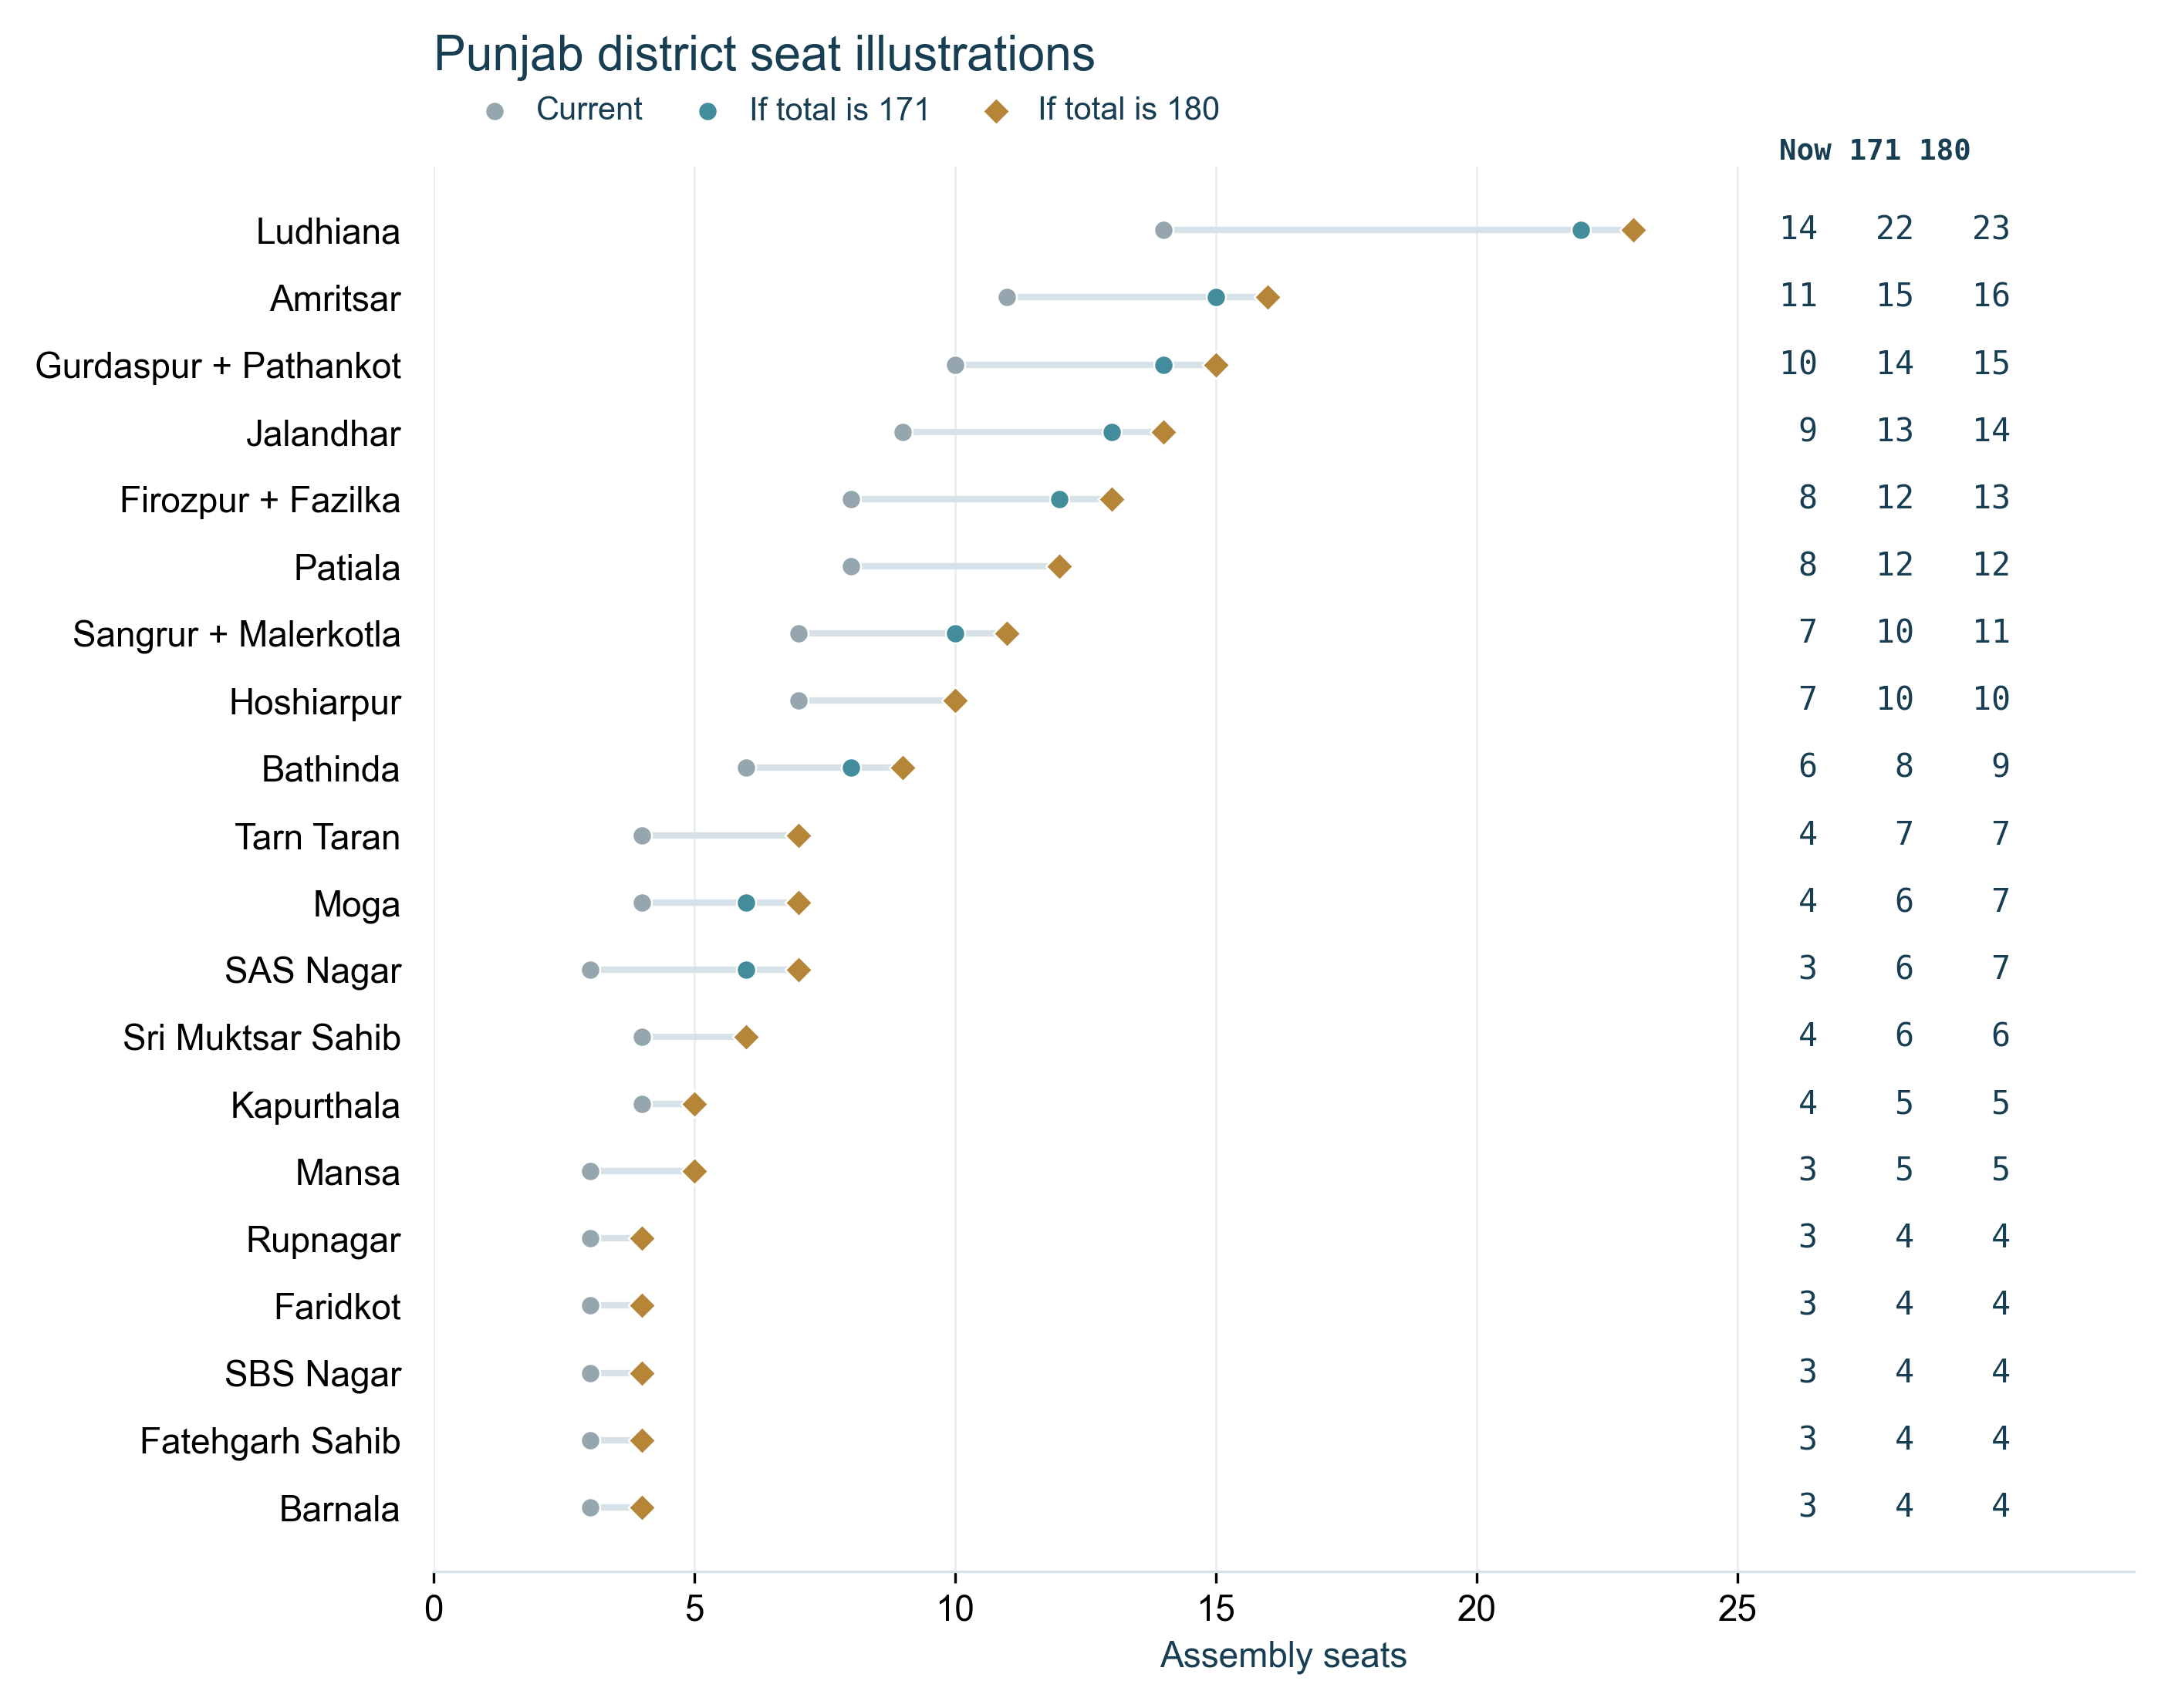
The same 20 district groups appear in the table and charts. Current seats are shown beside the two population-based illustrations.
Contact Panjteer to request the Punjab district Assembly illustrations.
Where the Census and electoral rolls fit
The different counts can be kept in view without merging them. SIR concerns eligible registered voters and electoral-roll entries. The Census counts population and provides migration tables. Delimitation uses the Census population authorised by law together with its allocation and boundary rules.
The calculations in this article use either the 2011 population or the existing allocation of seats. No booth-wise ASDD count enters these seat formulas. The authorised Census population and the allocation framework are the inputs for the population case.
What still has to be decided
A future allocation would need an authorised population basis, the size of the House, state and UT limits, a rule for protected seats and a method for whole seats. Punjab’s Assembly total would require its own decision within the governing framework. Boundary and reservation work would follow the applicable process.
The four calculations make those choices visible. With the same 850-seat total, the population rule and the rule based on existing allocations produce different state results. With the same state increases, a UT pool of 35 and a UT total of 32 produce different national shares. The full tables and Excel file let readers examine each comparison with its assumptions in place.
Request the research calculations
The Excel workbook, all state and Union Territory results, regional results, and Punjab district Assembly illustrations are available on request from Panj Teer Research. The workbook includes the assumptions, formulas, inputs and calculation checks.
Contact Panjteer on Instagram to request the research calculations.
State and Union Territory allocation appendix
| State or UT |
Current |
Case 1 |
Case 2 |
Case 3a |
Case 3b |
| Andaman And Nicobar Islands |
1 |
1 |
1 |
2 |
2 |
| Andhra Pradesh |
25 |
38 |
34 |
38 |
39 |
| Arunachal Pradesh |
2 |
3 |
2 |
3 |
3 |
| Assam |
14 |
21 |
22 |
21 |
22 |
| Bihar |
40 |
60 |
73 |
60 |
63 |
| Chandigarh |
1 |
1 |
1 |
2 |
2 |
| Chhattisgarh |
11 |
17 |
18 |
17 |
17 |
| Dadra And Nagar Haveli And Daman And Diu |
2 |
2 |
2 |
3 |
3 |
| Delhi |
7 |
16 |
11 |
11 |
11 |
| Goa |
2 |
3 |
2 |
3 |
3 |
| Gujarat |
26 |
39 |
42 |
39 |
41 |
| Haryana |
10 |
15 |
17 |
15 |
16 |
| Himachal Pradesh |
4 |
6 |
5 |
6 |
6 |
| Jammu And Kashmir |
5 |
12 |
8 |
8 |
8 |
| Jharkhand |
14 |
21 |
23 |
21 |
22 |
| Karnataka |
28 |
42 |
43 |
42 |
44 |
| Kerala |
20 |
30 |
23 |
30 |
31 |
| Ladakh |
1 |
1 |
1 |
2 |
2 |
| Lakshadweep |
1 |
1 |
1 |
2 |
2 |
| Madhya Pradesh |
29 |
44 |
51 |
44 |
45 |
| Maharashtra |
48 |
72 |
79 |
72 |
75 |
| Manipur |
2 |
3 |
2 |
3 |
3 |
| Meghalaya |
2 |
3 |
2 |
3 |
3 |
| Mizoram |
1 |
2 |
1 |
2 |
2 |
| Nagaland |
1 |
2 |
1 |
2 |
1 |
| Odisha |
21 |
32 |
29 |
32 |
33 |
| Puducherry |
1 |
1 |
1 |
2 |
1 |
| Punjab |
13 |
20 |
19 |
20 |
20 |
| Rajasthan |
25 |
38 |
48 |
38 |
39 |
| Sikkim |
1 |
2 |
1 |
2 |
1 |
| Tamil Nadu |
39 |
59 |
50 |
59 |
61 |
| Telangana |
17 |
26 |
24 |
26 |
27 |
| Tripura |
2 |
3 |
2 |
3 |
3 |
| Uttar Pradesh |
80 |
120 |
140 |
120 |
125 |
| Uttarakhand |
5 |
8 |
7 |
8 |
8 |
| West Bengal |
42 |
63 |
64 |
63 |
66 |
| India |
543 |
827 |
850 |
824 |
850 |
All future columns are Panj Teer research calculations under the stated assumptions. Case 1 includes the illustrative population-based UT split.
Notes on the calculations and sources
- The 2011 populations sum to 1,21,08,54,977 across the present 36-unit calculation geography. Andhra Pradesh uses 4,95,77,103 and Telangana 3,50,03,674, adjusted for the later boundary transfer and supported by the government sources listed below. J&K and Ladakh divide the former state, and the merged Dadra and Nagar Haveli and Daman and Diu is one unit. These are historical counts, not current estimates.
- Case 1 gives each of 28 states the smallest whole number at least 1.5 times its current allocation. These sum to 792. The exact UT pool of 35 makes 827. The choice to fill 35 UT seats, the internal UT allocation and upward rounding are research assumptions; the introduced amendment gave ceilings rather than this complete schedule.
- For a fixed population pool, each unit starts with the whole-number part of its quota or its current seats, whichever is higher. Seats are then added to the greatest quota-minus-assigned shortfall. If a pool is above its target, seats are removed using the greatest assigned-minus-quota excess, only from units still above their minimum. Alphabetical unit order breaks ties. The Excel adjustment sheets show the sequence.
- Case 2 uses one 850-seat national pool, with all current allocations protected. It produces 824 state seats and 26 UT seats. Its state total exceeds the introduced amendment’s proposed 815 ceiling and therefore represents an alternative ceiling arrangement.
- Case 3a multiplies each of 36 current allocations by 1.5 and rounds half-seats upward. The total is 824. Case 3b multiplies existing allocations by 850/543 and uses whole seats to reach 850; no population quota is substituted. Its 819 state seats also exceed the proposed 815 state ceiling.
- Case 1’s 827 and Case 3a’s 824 are separate calculations from the government’s published 816 illustration. The official releases provide five southern-state examples totalling 195 but no full national allocation. Dividing 195 by 816 gives about 23.90%.
- Punjab’s future Assembly illustrations retain nine as a research assumption. The Excel input for that multiple can be changed. The Assembly examples do not draw future constituencies, determine their reservation status or allocate a district’s final number of seats.
- The maps use the supplied state/UT and Punjab Assembly outlines as geographic illustrations. Colours on the national case maps represent calculated allocations, not future boundary proposals. Small UTs are identified fully in the table. The national maps and calculation file use the present names and units for comparison.
- In the timeline, the 84th Amendment is identified by its verified assent date of 21 February 2002. Consolidated constitutional references use the Act’s 2001 title. The Department’s standalone compilation labels it inconsistently; that does not change the assent date or the substantive Census-linked provision.
- GST Council recommendations and statutory requirements must be distinguished. Mohit Minerals, paragraph 148, addresses their recommendatory status for primary legislation and the separate requirements attached to delegated rule-making under GST statutes.
- Legal references for the institutional discussion include Articles 3, 75, 80–82, 109, 170, 246, 248–254, 256–257, 270–271, 312, 352, 356 and 368. The account identifies powers and conditions; it does not adjudicate a particular disputed executive action.
- Assam’s historical facts, ECI methodology, political allegations and responses are identified separately. The Supreme Court reference describes its interim order of 24 July 2023, not a statement about the later status of those proceedings. No estimate of an electoral result caused by the new boundaries is made here.
- Punjab district illustrations use the population-share method on 20 Census district groups. Whole quotas are assigned first, then the largest remaining fractions receive seats; alphabetical district names break ties. The statewide totals remain exact. The method does not select villages, wards, future reserved seats or an individual parliamentary boundary. Current district grouping follows the constituency records; small administrative transfers would require a separate boundary reconstruction.
Sources
- CEO Punjab constituency counts
- ECI explanation and earlier delimitation commissions
- Delimitation Act 2002 sections 8 to 10
- 42nd Amendment text including the freeze and list changes
- 84th Amendment text and statement of reasons
- Ministry account of the 2003 change to the 2001 boundary Census base
- Constitution 131st Amendment Bill 2026 as introduced
- Delimitation Bill 2026 as introduced
- Home Minister’s 16 April illustration
- Home Minister’s 17 April reply
- Ministry of Parliamentary Affairs account of the April outcome
- Constitution of India English provisions in the official 2025 edition
- Rajya Sabha official FAQ and state allocation
- Third Amendment enacted change to Concurrent List entry 33
- 88th Amendment text and statement of reasons
- Supreme Court judgment of 8 August 2024 paragraphs 6.2 and 6.3 on service tax
- 101st Amendment text published by CBIC
- GST Council official explanation of its composition and voting
- Supreme Court Mohit Minerals judgment of 19 May 2022 paragraph 148
- National Investigation Agency Act section 6
- ECI Jammu and Kashmir delimitation order publication
- Presidential commencement order for Assam delimitation
- Parliamentary answer of 3 April 2025 listing commissions including 2020
- Census of India 2011 population tables
- Government of India MSME profile with Andhra Pradesh’s adjusted 2011 population
- Telangana government Socio Economic Outlook 2021 demographic annexure
- ECI final Assam delimitation release of 11 August 2023 and published methodology
- Supreme Court interim order in Hirendranath Gohain of 24 July 2023
- ECI draft Assam delimitation release of 20 June 2023
- The Indian Express reporting of objections and named political statements on 15 August 2023
- The Indian Express reporting of the BJP response to the Assam draft in June 2023
- The Indian Express account of the renewed gerrymandering allegations in April 2026