Punjab migration in the Census record
Punjab’s count of residents whose previous home was elsewhere in India rose from 17.5 lakh in 2001 to 24.9 lakh in 2011.
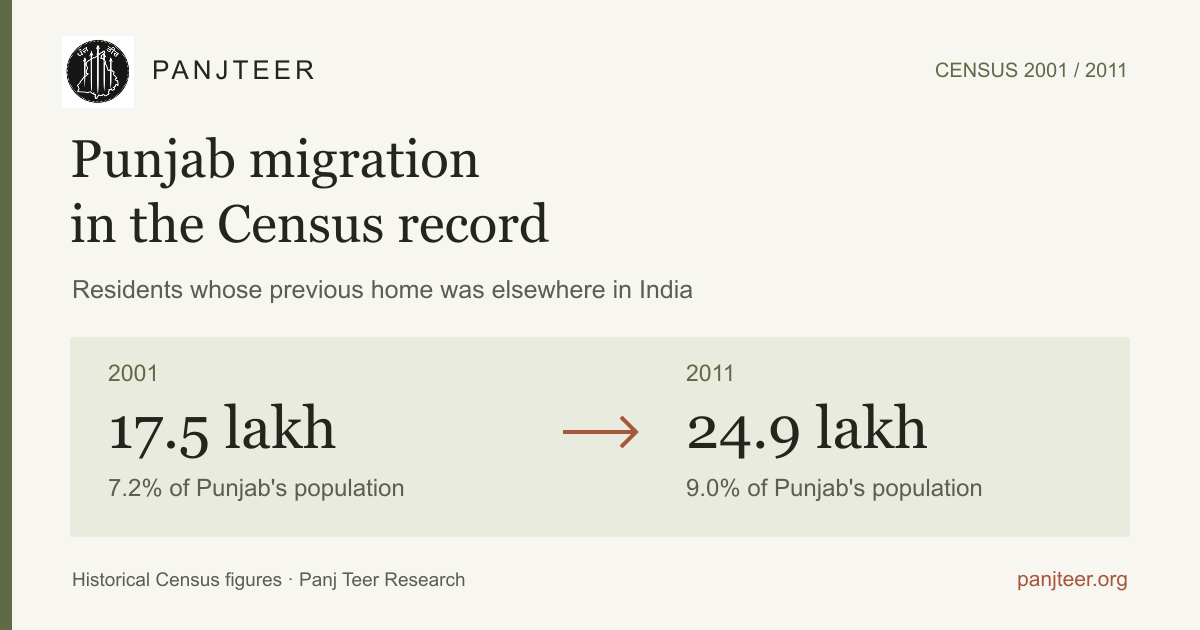
Punjab had 24,88,299 residents whose previous home was in another Indian state or Union Territory when the 2011 Census was taken. They formed about 9% of the state’s population. The corresponding count in 2001 was 17,49,122, or about 7.2%.
The figures come from the Census table on place of last residence. They describe a particular kind of migration: people living in Punjab who had previously lived elsewhere in India. The tables also record the district where they were counted, their earlier state or Union Territory, and how long they had lived in the town or village where the Census found them.
How the Census counts migration
A person’s previous home and birthplace are different pieces of information. Someone born in Punjab who lived in another state and later returned can fall within this category. The classification is based on previous residence, rather than language, community or cultural identity.
The figures used here include people of all ages, both sexes and all lengths of residence. They include people counted in rural and urban Punjab. This is not a count confined to workers or to people who moved recently.
The wider Census migration table has separate categories for moves within Punjab and previous residence outside India. Those categories are outside the 24.9 lakh figure used here. It is also not a count of people who left Punjab for another state or another country.
What changed between 2001 and 2011
The number in the comparable Census category increased by 7,39,177 between the two Censuses, a rise of 42.3%. Its share of Punjab’s population increased from 7.2% to 9.0%.
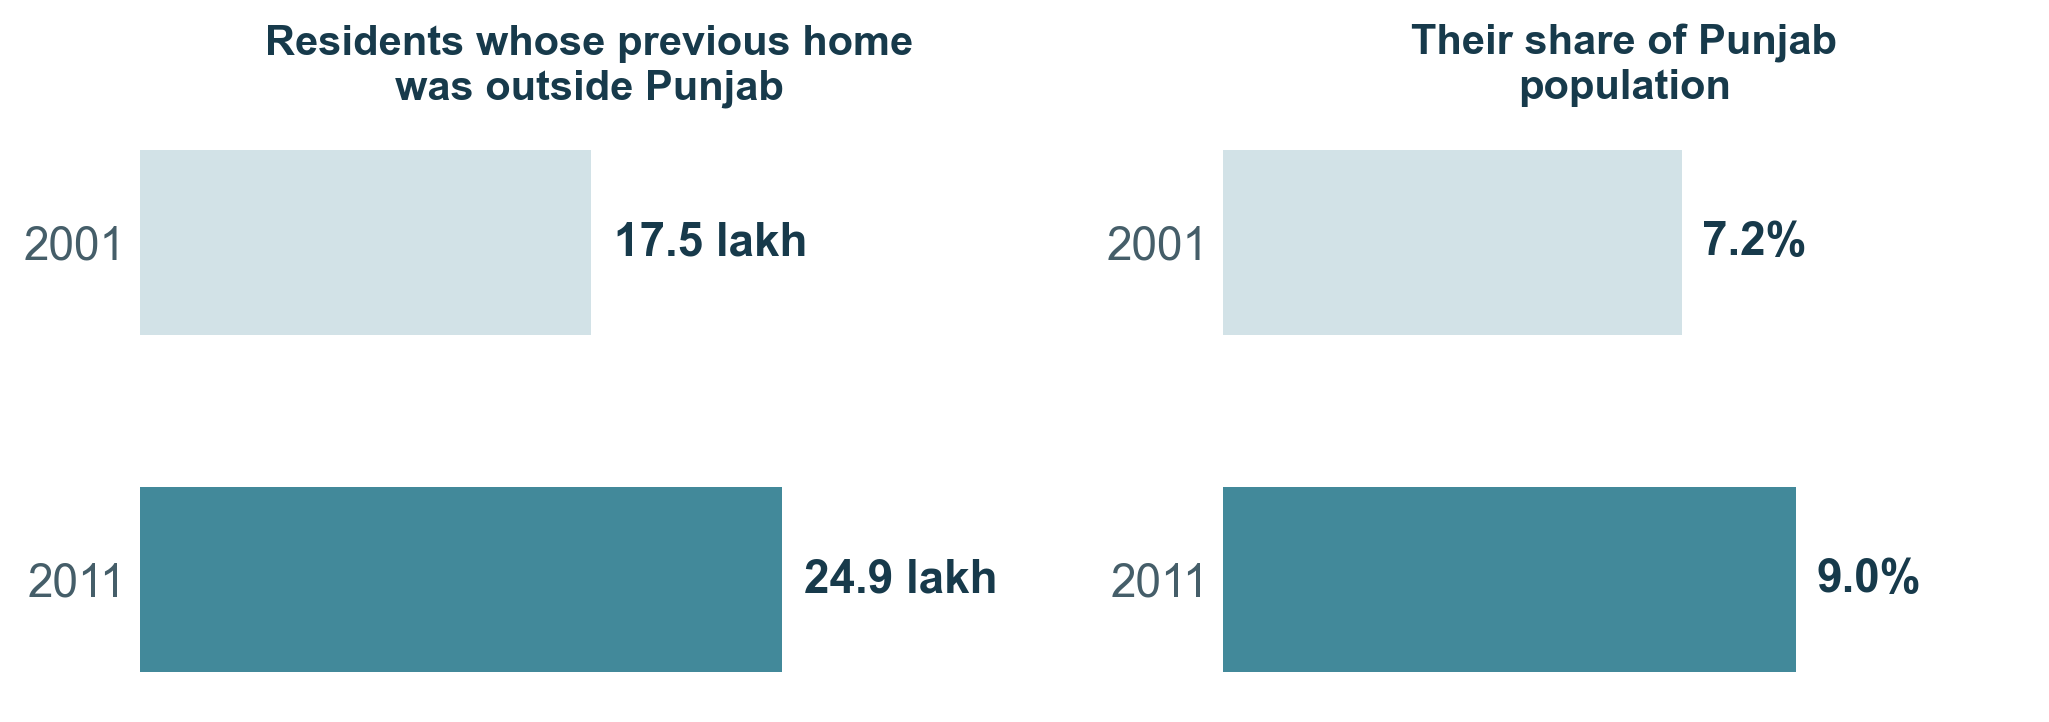
Residents whose previous home was outside Punjab, within India. Both years include all ages and all residence durations. Sources: Census of India D-02, 2001 and 2011; Census population totals.
| Census year | Punjab population | Previous home elsewhere in India | Share of Punjab population |
|---|---|---|---|
| 2001 | 2,43,58,999 | 17,49,122 | 7.2% |
| 2011 | 2,77,43,338 | 24,88,299 | 9.0% |
Each Census total describes the residents present at that point in time. The increase of 7.39 lakh is the difference between those two totals. It is not the number of all arrivals during the decade, and the two totals do not provide an annual migration count.
SAS Nagar had the highest district share
SAS Nagar recorded 3,28,956 residents with a previous home elsewhere in India in 2011. They formed 33.1% of its population, the highest share among Punjab’s 20 Census districts.
Ludhiana had the largest district count, at 4,95,206. Its population share was 14.2%. Rupnagar recorded 13.3%, Patiala 11.7%, Bathinda 11.0%, Fatehgarh Sahib 10.7% and Jalandhar 9.3%.
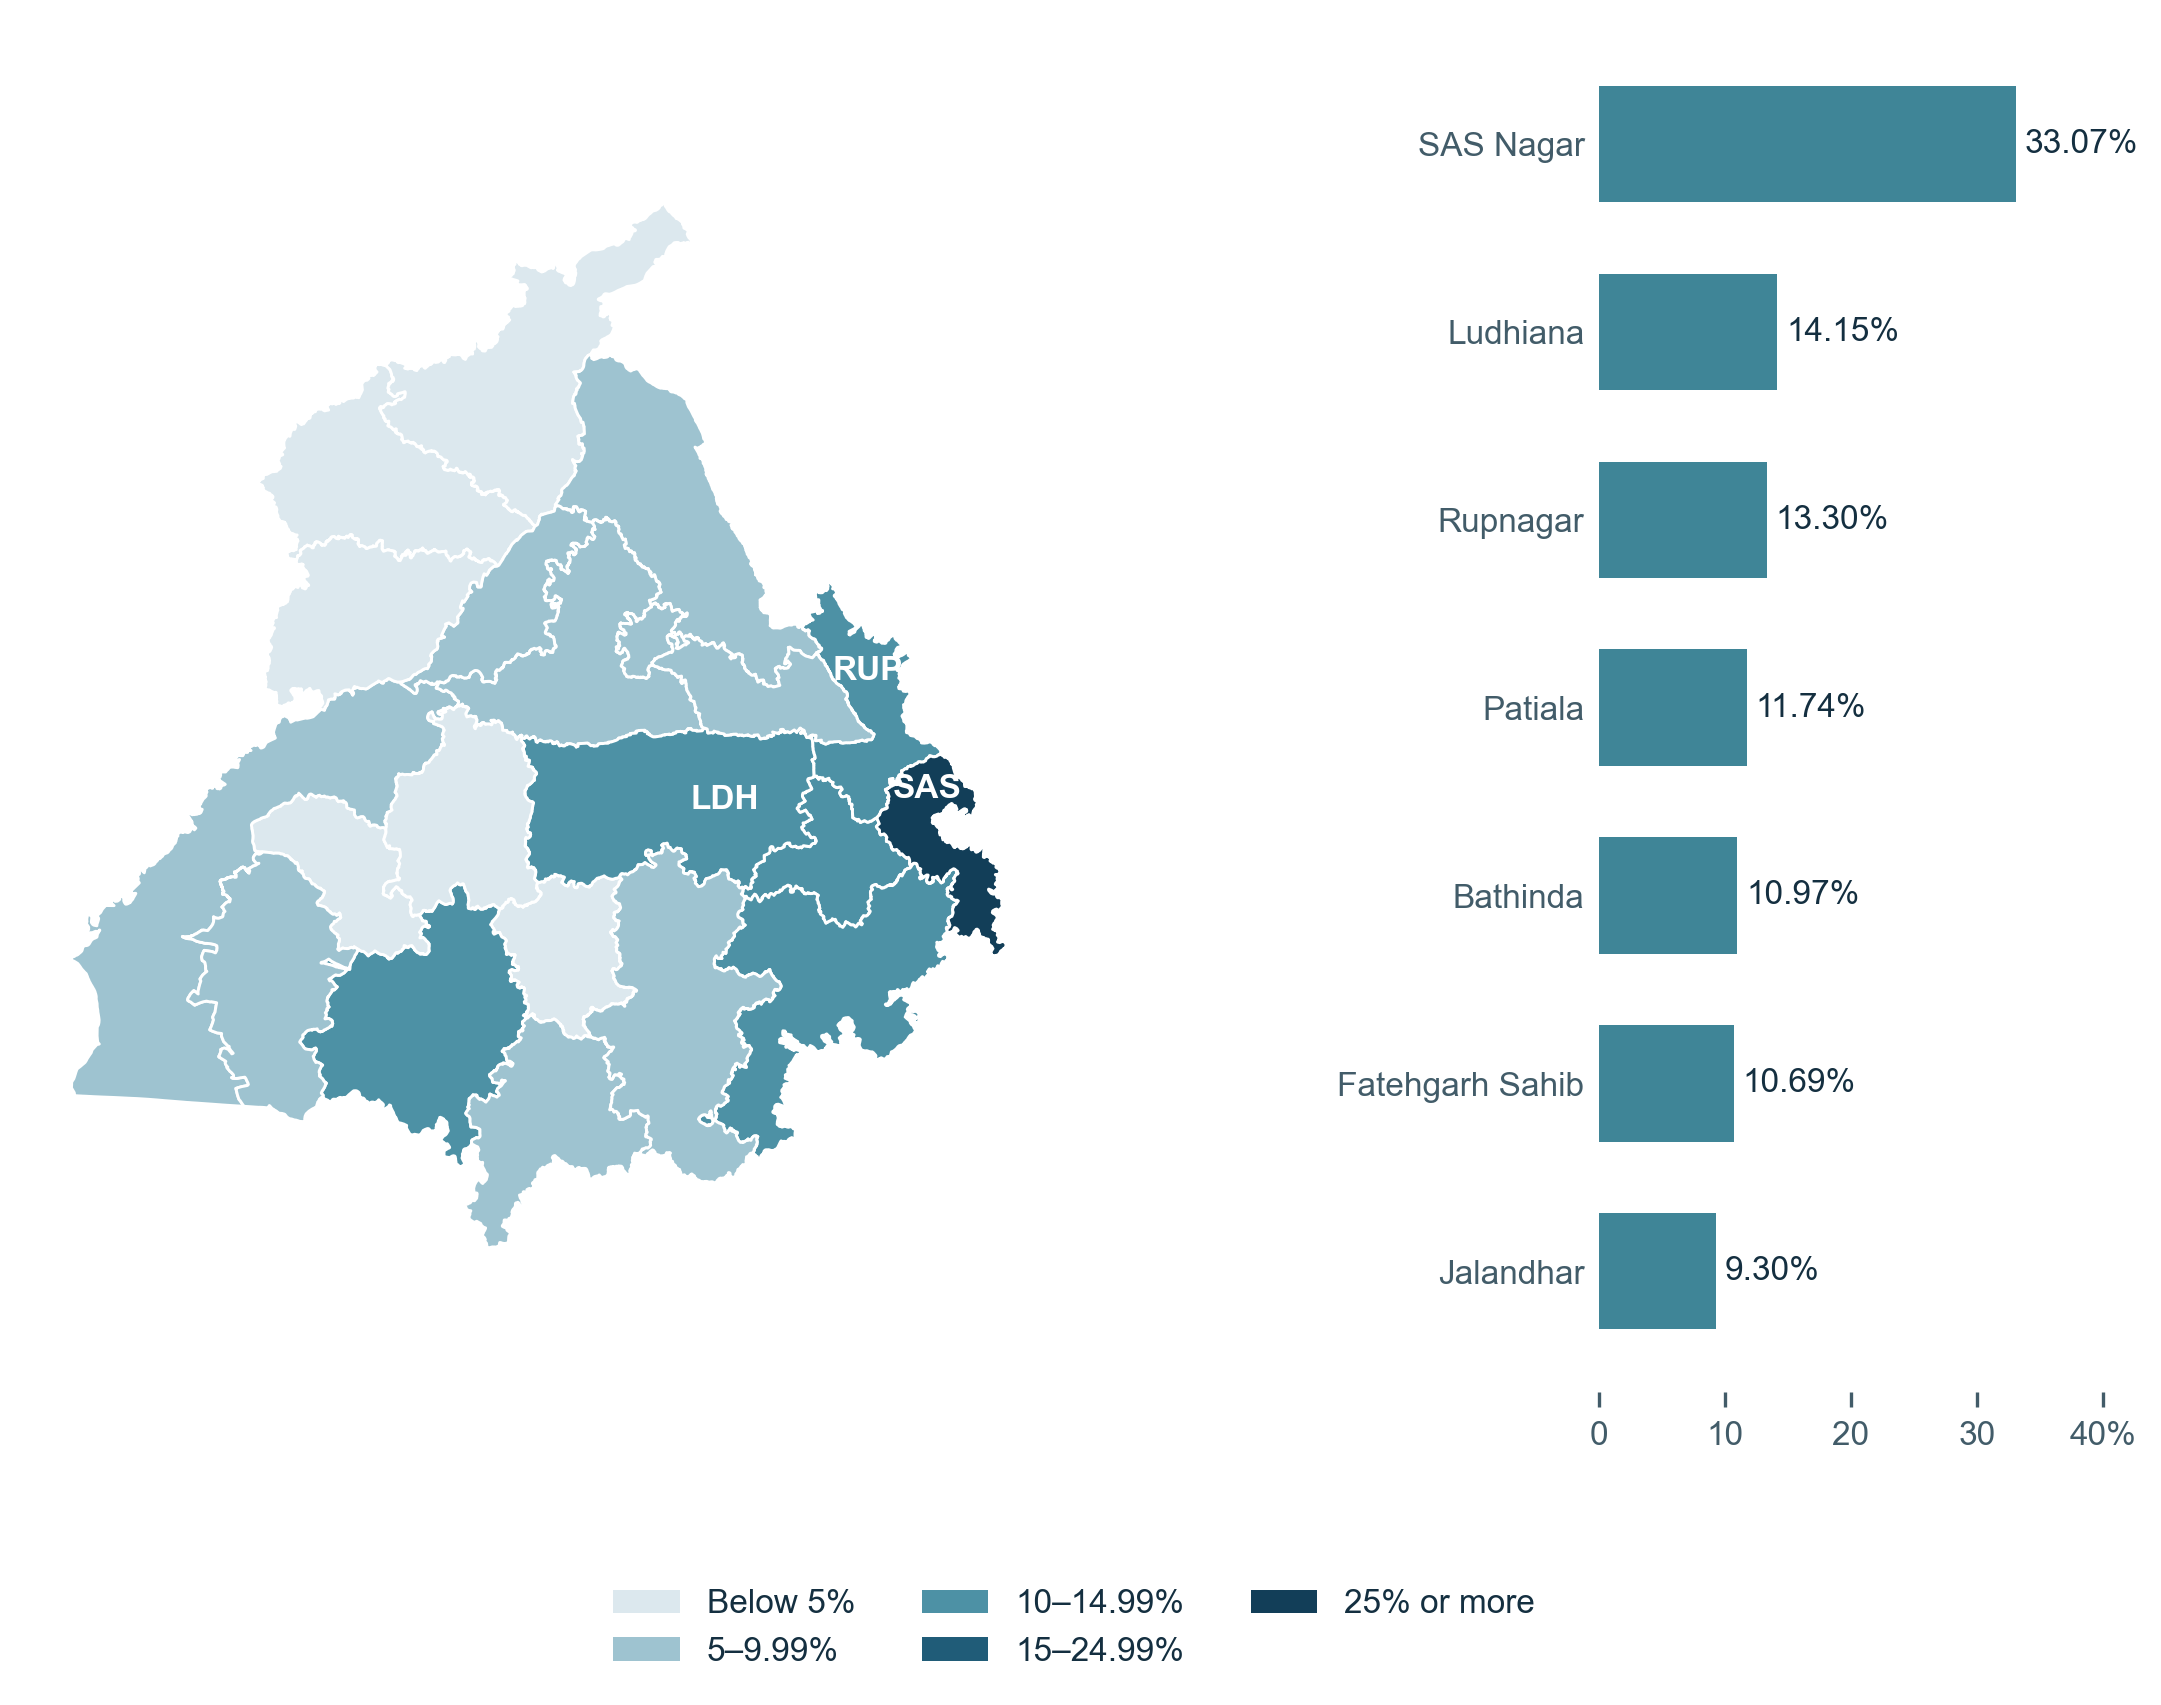
Previous residence outside Punjab as a share of district population in 2011. The map groups later boundaries to display the 20 historical areas. SAS means SAS Nagar, LDH means Ludhiana and RUP means Rupnagar. Sources: Census of India; LGD boundaries via Bharatlas.
The district figures belong to the geography used in the 2011 Census. The district appendix keeps those 20 areas together, including Gurdaspur before Pathankot was separated, Firozpur before Fazilka was separated, and Sangrur before Malerkotla was separated.
The language figures alongside migration
The Census also asked residents about their mother tongue, meaning the language spoken to them in childhood by their mother, or mainly spoken at home if their mother died in infancy. This is a separate question from where they lived before Punjab.
The table below uses the Census’s broad language groups. The Punjabi group accounted for 91.7% of Punjab’s population in 2001 and 89.8% in 2011. Its count rose from 2.23 crore to 2.49 crore. The Hindi group rose from 7.6% to 9.4%, with its count increasing from 18.5 lakh to 25.9 lakh.
| Census language group | 2001 people and population share | 2011 people and population share |
|---|---|---|
| Punjabi group | 2,23,34,369 (91.7%) | 2,49,17,885 (89.8%) |
| Hindi group | 18,51,128 (7.6%) | 25,94,831 (9.4%) |
| All other language groups | 1,73,502 (0.7%) | 2,30,622 (0.8%) |
The Hindi group includes several mother-tongue entries. In Punjab’s 2011 table, the entry named Hindi records 21,79,066 people. Bhojpuri records 60,271 and Haryanvi 36,675. These and other entries are already included in the broader Hindi-group total of 25,94,831.
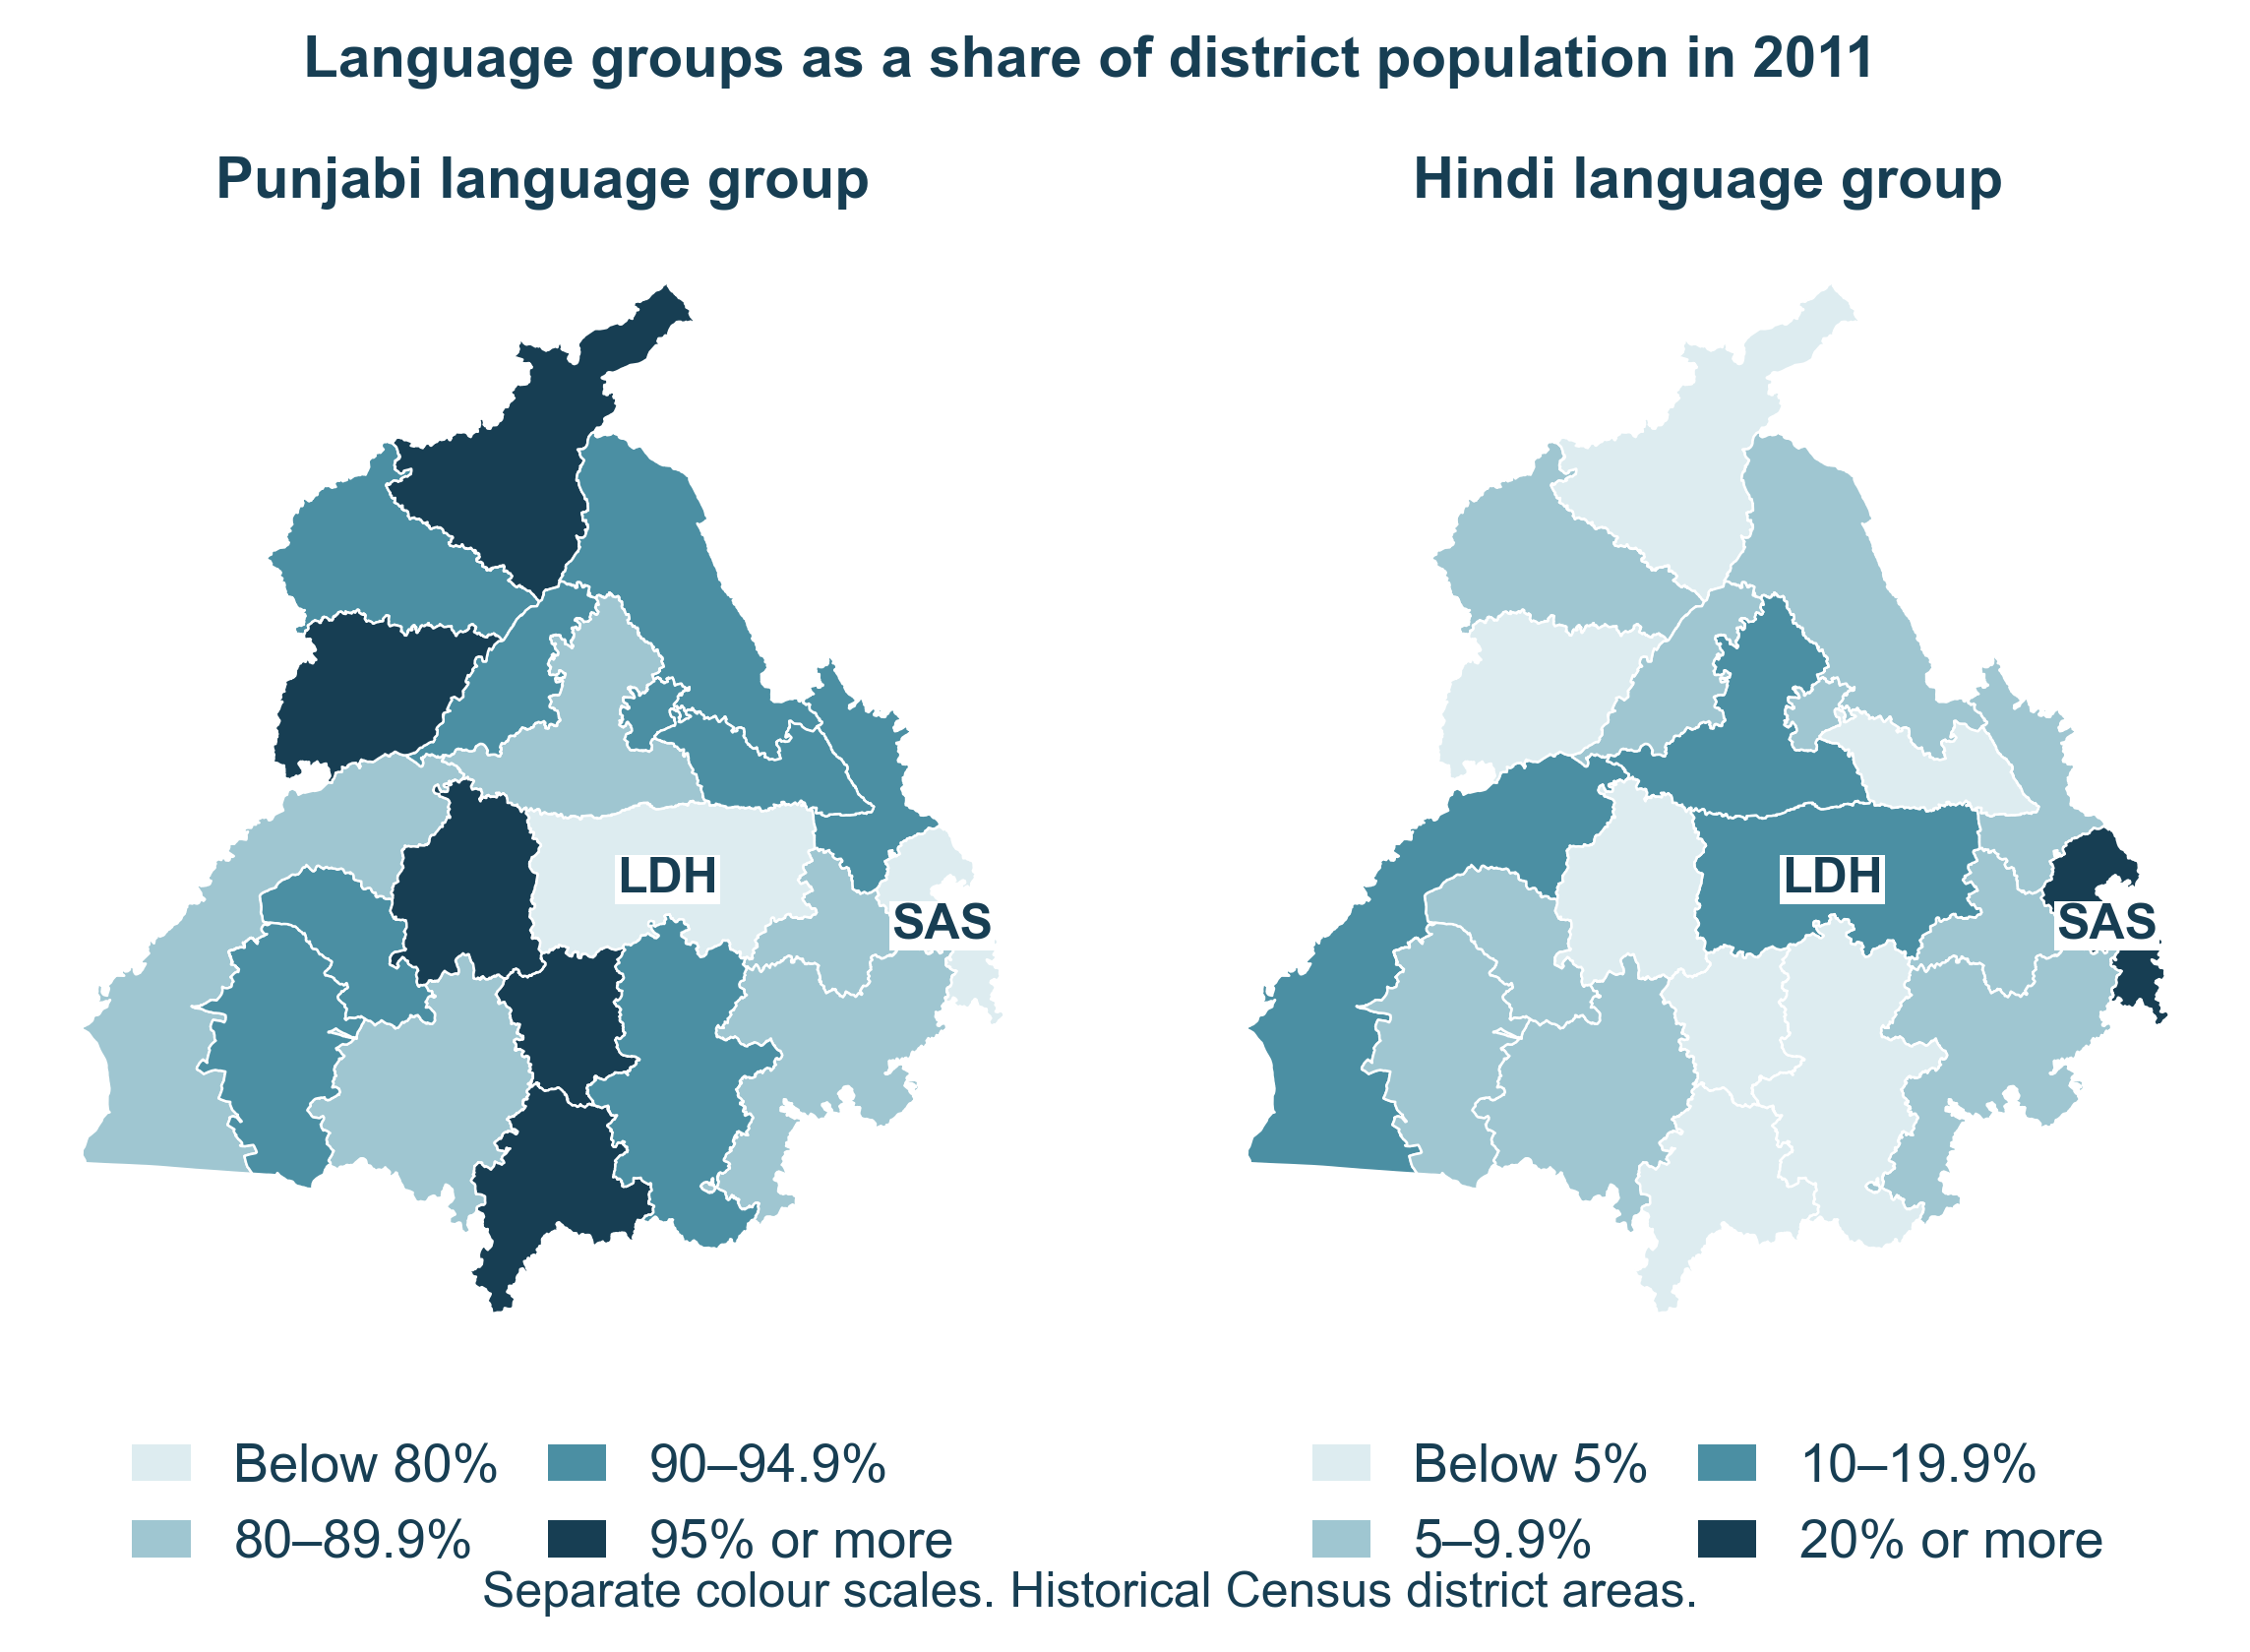
Punjabi and Hindi language groups as shares of all residents in each 2011 district. The maps use separate colour scales. SAS means SAS Nagar and LDH means Ludhiana. These are language totals for all residents, not just people in the migration category. Sources: Census C-16; LGD district outlines via Bharatlas.
SAS Nagar recorded 74.7% of its population in the Punjabi group and 24.0% in the Hindi group. Its share with a previous home elsewhere in India was 33.1%. Ludhiana’s corresponding figures were 79.7%, 19.5% and 14.2%. The district appendix places the three measures side by side for all 20 districts.
The language table counts all residents by their recorded mother tongue. The migration table counts people by their previous residence. This comparison joins district totals, not individual language and migration records.
Where people had lived before Punjab
Uttar Pradesh was the largest recorded place of previous residence, accounting for 6,49,557 people. Haryana followed with 5,45,584 and Bihar with 3,52,537. Himachal Pradesh, Rajasthan and Chandigarh were the next three entries by count.
| Previous residence | People counted in Punjab in 2011 | Share of this migrant group |
|---|---|---|
| Uttar Pradesh | 6,49,557 | 26.1% |
| Haryana | 5,45,584 | 21.9% |
| Bihar | 3,52,537 | 14.2% |
| Himachal Pradesh | 2,14,213 | 8.6% |
| Rajasthan | 2,02,166 | 8.1% |
| Chandigarh | 1,49,591 | 6.0% |
| Other Indian states and Union Territories | 3,74,651 | 15.1% |
Previous residence does not necessarily mean birthplace or the place where a family originally came from. These figures record the home before the move to the place where the person was counted.
SAS Nagar and Ludhiana had different recorded origins
Chandigarh accounted for 1,10,136 of SAS Nagar’s residents in this category, or 33.5% of the group. Haryana accounted for 85,676, or 26.0%, and Uttar Pradesh for 57,998, or 17.6%.
In Ludhiana, Uttar Pradesh accounted for 2,12,482 people, or 42.9% of the group. Bihar accounted for 1,22,533, or 24.7%, and Haryana for 53,864, or 10.9%.
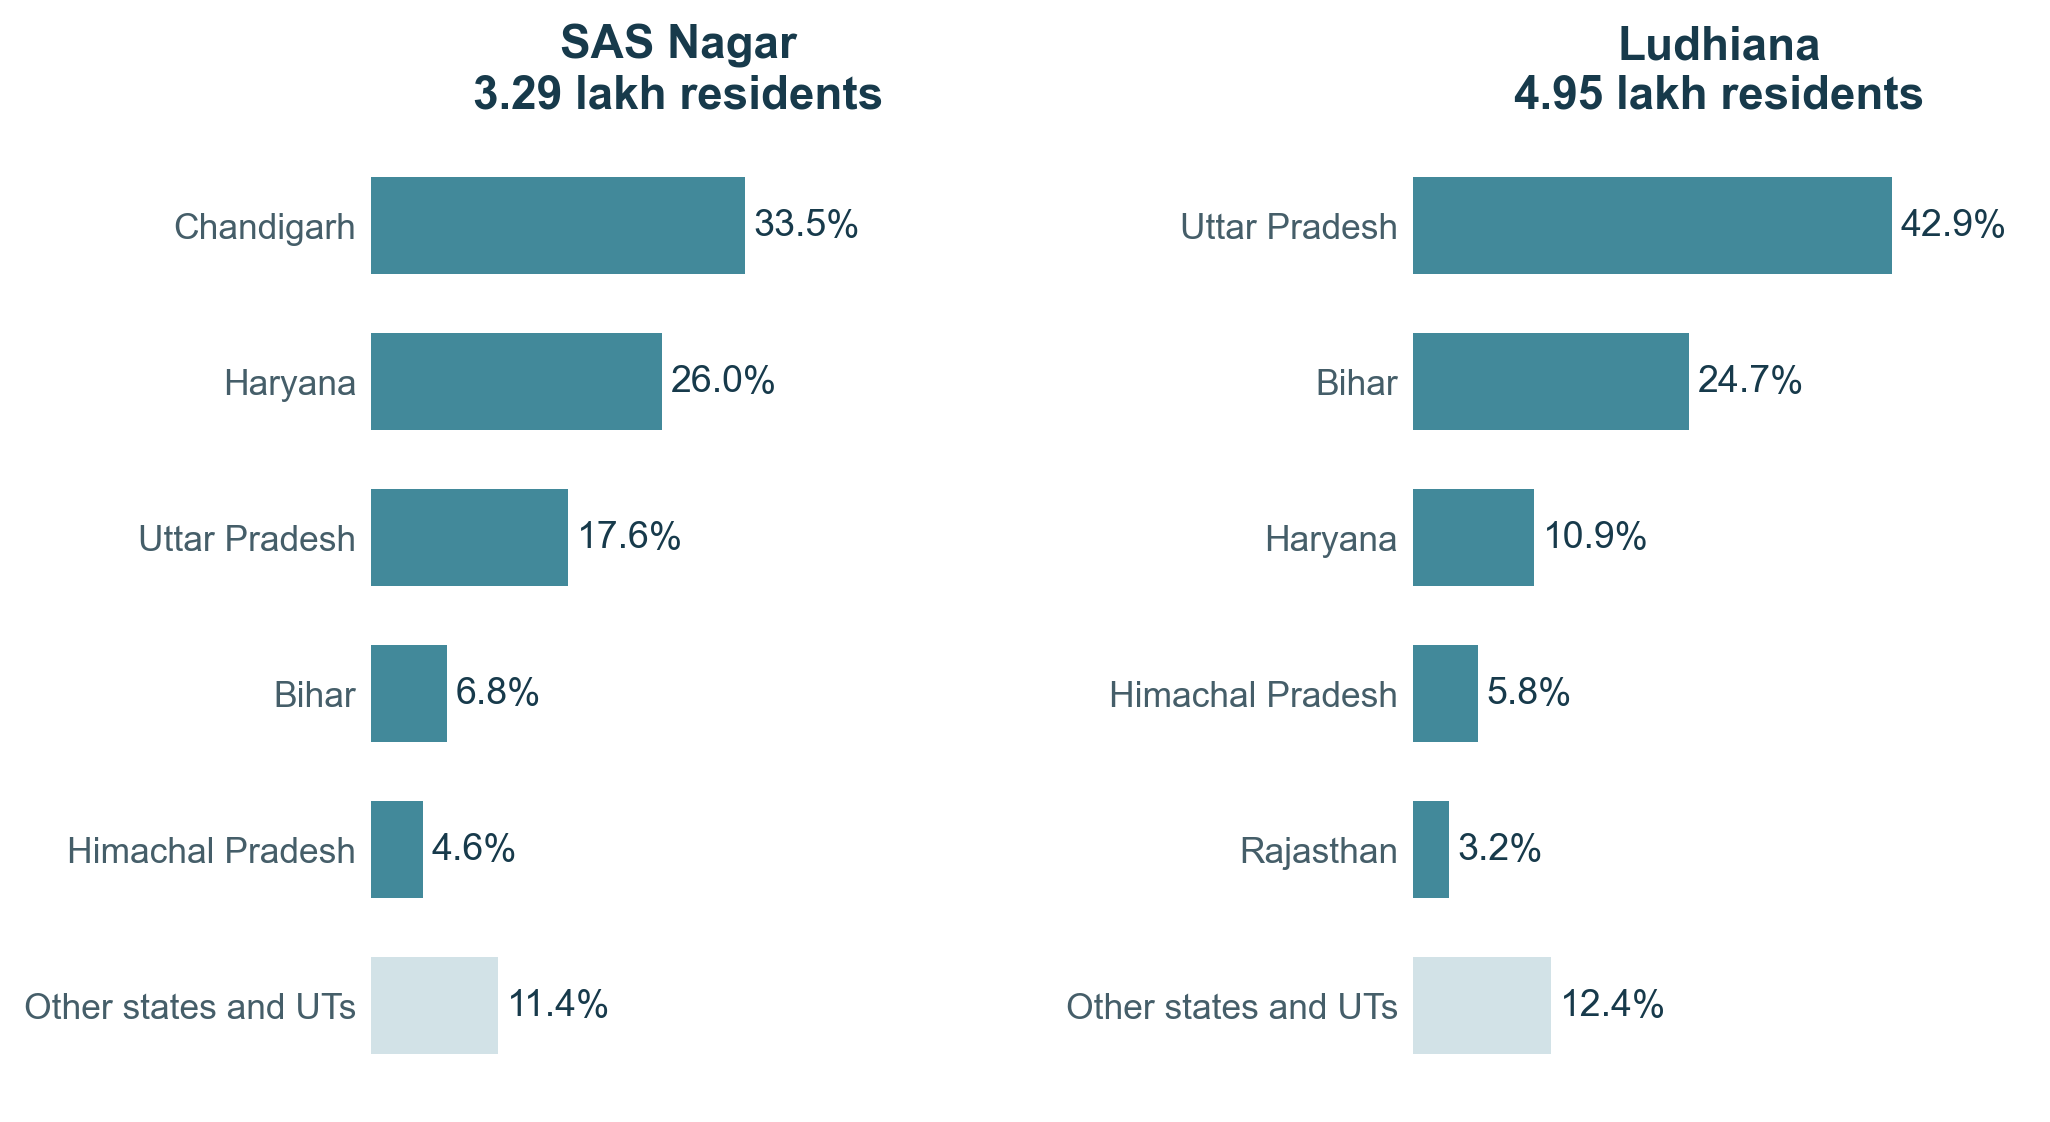
Each percentage uses the district’s residents with a previous home elsewhere in India as the total. These are Census figures, not percentages of SIR lists. Source: Census 2011 D-02.
Many had lived in the same town or village for years
Of the 24.9 lakh residents counted statewide, 1,93,462 had lived in the place where they were counted for less than a year. Another 4,45,716 had lived there for one to four years, and 3,80,351 for five to nine years.
The Census recorded 5,42,894 with ten to nineteen years of residence and 6,33,619 with twenty years or more. Duration was not stated for 2,92,257 people. Together, about 10.2 lakh had less than ten years of residence and about 11.8 lakh had ten years or more.
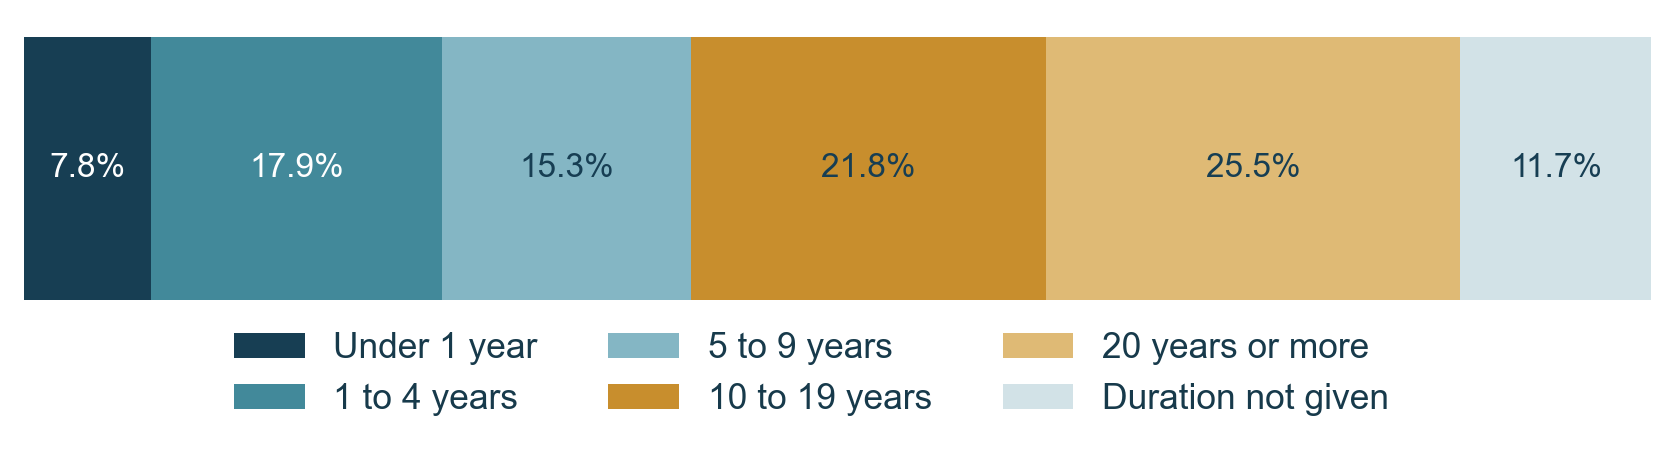
Length of residence in the town or village where people were counted. Percentages refer to the 24,88,299 residents with a previous home elsewhere in India. Source: Census 2011 D-02.
Duration here refers to residence in the place of enumeration, such as a town or village. It is not a record of years spent at a particular house or street address.
The district comparison with SIR
The Special Intensive Revision, or SIR, reviewed Punjab’s voter rolls in 2026. Its ASDD lists record names under absent, shifted, dead and duplicate categories. Panj Teer’s comparison places the 2011 district migrant share beside the share of 2026 ASDD names marked untraceable or absent.
SAS Nagar’s ASDD lists record 35.0% of listed names as untraceable or absent. Ludhiana records 30.4%, compared with 20.7% statewide. The Census percentage uses all residents of a district as its total. The SIR percentage uses names in that district’s ASDD lists.
SAS Nagar stands out most in the district comparison. The relationship is much weaker when SAS Nagar and Ludhiana are both left out, so we should examine these places separately before describing a Punjab-wide pattern.
The absent/untraceable pattern also varies within these districts: it ranges from 2.1% to 74.1% of listed names across Ludhiana’s constituencies, and from 21.1% to 45.9% across SAS Nagar’s.
The comparison joins district totals. Personal migration records have not been linked to individual names on the ASDD lists. The migration observations are from 2011 and the ASDD files were downloaded on 22 October 2026.
Request the research data
The district migration figures, 2001 and 2011 language-group figures, district language and migration comparison, and district comparison with SIR are available on request from Panj Teer Research.
Contact Panjteer on Instagram to request the research data.
District appendix
The 20 districts used in the 2011 Census, ordered by the share of residents whose previous home was elsewhere in India. All three percentage columns use each district’s full population. These are historical Census figures, rather than counts for 2026.
| District in 2011 | Population | Previous home elsewhere in India | Previous home share | Punjabi group share | Hindi group share |
|---|---|---|---|---|---|
| SAS Nagar | 9,94,628 | 3,28,956 | 33.1% | 74.7% | 24.0% |
| Ludhiana | 34,98,739 | 4,95,206 | 14.2% | 79.7% | 19.5% |
| Rupnagar | 6,84,627 | 91,086 | 13.3% | 92.6% | 6.9% |
| Patiala | 18,95,686 | 2,22,478 | 11.7% | 89.6% | 8.5% |
| Bathinda | 13,88,525 | 1,52,321 | 11.0% | 89.6% | 9.4% |
| Fatehgarh Sahib | 6,00,163 | 64,176 | 10.7% | 89.9% | 9.7% |
| Jalandhar | 21,93,590 | 2,03,905 | 9.3% | 88.2% | 10.6% |
| Mansa | 7,69,751 | 66,826 | 8.7% | 96.5% | 3.3% |
| Kapurthala | 8,15,168 | 64,296 | 7.9% | 91.2% | 8.1% |
| Hoshiarpur | 15,86,625 | 1,24,456 | 7.8% | 93.7% | 5.8% |
| Firozpur | 20,29,074 | 1,50,729 | 7.4% | 80.5% | 18.8% |
| Muktsar | 9,01,896 | 64,461 | 7.1% | 92.1% | 7.7% |
| Sangrur | 16,55,169 | 98,932 | 6.0% | 94.9% | 4.7% |
| Shahid Bhagat Singh Nagar | 6,12,310 | 34,684 | 5.7% | 94.6% | 4.9% |
| Barnala | 5,95,527 | 29,632 | 5.0% | 95.1% | 4.6% |
| Faridkot | 6,17,508 | 30,149 | 4.9% | 91.8% | 7.4% |
| Amritsar | 24,90,656 | 1,15,866 | 4.7% | 94.3% | 5.1% |
| Gurdaspur | 22,98,323 | 1,01,720 | 4.4% | 95.8% | 2.6% |
| Moga | 9,95,746 | 32,324 | 3.2% | 96.2% | 3.4% |
| Tarn Taran | 11,19,627 | 16,096 | 1.4% | 99.0% | 0.8% |
| Punjab | 2,77,43,338 | 24,88,299 | 9.0% | 89.8% | 9.4% |
About the figures
The migration count uses Census D-02, persons, total place of enumeration, total previous rural/urban residence and all durations, selecting last residence in Indian states beyond Punjab. The category includes other states and Union Territories. The 2001 figure is from the corresponding Punjab row in the national D-02 table. Population totals provide the percentage denominators.
Language figures use C-16 total persons, rural and urban combined. Punjabi and Hindi are the Census language-group totals, codes 016000 and 006000, including the mother tongues grouped under each. Component rows are not added again. All other language groups are the population total less these two groups. These figures concern mother tongue, rather than every language a person knows or uses. The two years are compared at Punjab level; district comparisons use the common 2011 geography.
The map displays historical district areas by grouping later district boundaries. For the comparison with SIR, Pathankot is grouped with Gurdaspur, Fazilka with Firozpur, and Malerkotla with Sangrur. Smaller village transfers have not all been reconstructed. District names are standardised for matching; SAS Nagar and SBS Nagar are shortened names.
The district comparison has 20 observations. The ordinary correlation between the 2011 migrant share and the untraceable/absent share of the 2026 ASDD lists is 0.78. It is 0.46 without SAS Nagar, 0.81 without Ludhiana, and 0.17 without both. The rank correlation for all 20 is 0.27. These calculations compare district shares, rather than matched personal records.
ASDD percentages use listings in the available booth files. They are not percentages of a district’s full electorate or counts of confirmed final removals. The snapshot contains 25,286 available files and leaves out 46 unavailable files. The two within-district percentage ranges quoted in the article also use ASDD listings as their totals.
Sources
- Census 2001 D-02 migration table
- Census 2011 Punjab D-02 migration table
- Census 2011 population totals
- Census 2001 population control in the Mansa handbook
- CEO Punjab ASDD booth lists
- LGD district boundaries via Bharatlas
- Census 2001 Punjab C-16 mother-tongue table
- Census 2011 Punjab C-16 mother-tongue table
- Census 2011 language and mother-tongue groupings
- Census 2011 instructions on mother tongue